


Prolactin-releasing peptide (PrRP) and its G-protein-coupled receptor, GPR10, have been implicated in the central control of appetite and blood pressure. To determine whether mutations in these genes might contribute to morbid obesity, we screened both genes in 94 subjects with severe early-onset obesity. Four rare silent variants in PrRP and eight polymorphisms in GPR10 were found, two of which (V283I and P305L) altered amino acid sequence but were also found in U.K. Caucasian control subjects. Cells expressing the P305L variant receptor generated less intracellular calcium in response to PrRP than cells expressing the wild-type receptor. To examine whether genetic variation of the GPR10 locus might be associated with phenotypes relevant to obesity and/or blood pressure, the most common noncoding (G-62A) and coding (C914T [P305L]) polymorphisms were typed in 1,084 U.K. Caucasians. While no association was found with BMI, carriers of the P305L allelic variant had significantly lower systolic (123.95 vs. 128.55 mmHg, P < 0.05) and diastolic (74.90 vs. 78.20 mmHg, P < 0.01) blood pressure than wild-type subjects. In conclusion, we have conducted the first genetic study of GPR10 and its ligand PrRP in relation to metabolic phenotypes and have identified an association between GPR10 polymorphisms and diastolic and systolic blood pressure. The alteration in signaling properties of the receptor produced by P305L may provide a functional basis for this association.
The neuropeptide prolactin-releasing peptide (PrRP) and its cognate G-protein-coupled receptor, GPR10, were initially identified as possible regulators of prolactin release from the anterior pituitary lactotroph. Subsequently, however, some doubt has been cast on the assertion that the main physiological role of PrRP and its receptor is in the control of prolactin release. Both neuroanatomical studies of the ligand and its receptor, as well as the physiological responses to central administration of PrRP, suggest roles in other processes, such as feeding behavior and the central control of blood pressure (1,2). The anorectic effect of PrRP has been demonstrated by the dose-dependent reduction in nocturnal food intake that follows a single intracerebroventricular (ICV) injection of PrRP into free-moving male rats. In 24-h-fasted rats, ICV PrRP can also inhibit food intake when compared with ICV saline (1). A role for PrRP in the central control of blood pressure is suggested by the finding of a highly significant elevation in mean arterial blood pressure observed in conscious, unrestrained male rats following a single ICV injection of PrRP in comparison with their saline-treated controls (2). To date, there are no reported human genetic studies of PrRP or GPR10 in relation to obesity or blood pressure. We therefore undertook mutation detection studies of these two genes in 94 subjects with severe early-onset obesity.
Eight polymorphic sites were found in GPR10 and four in PrRP. Two of the GPR10 polymorphisms (V283I and P305L) resulted in amino acid changes; all of the variants in the PrRP gene were silent (Table 1). V283I and P305L were found at similar allele frequencies (1 and 7%, respectively) in normal-weight Caucasians. Thus, major loss-of-function mutations in either PrRP or its receptor do not appear to be a common cause of severe human obesity.
To examine whether genetic variation in GPR10 might contribute to the inherited component of variation in obesity, blood pressure, and other intermediate metabolic traits, we genotyped 1,084 unrelated U.K. Caucasian subjects from the prospective MRC Ely study (3,4) for the two common polymorphisms (G-62A and C914T [P305L]) that we identified in our initial screen. We recorded 1,084 valid genotypes for C914T and 1,026 for G-62A. Allele frequencies of the mutant alleles at the G-62A and C914T polymorphic loci in the Ely cohort were 0.25 and 0.04, respectively. Neither polymorphism deviated significantly from Hardy-Weinberg predictions, and the two variants were in linkage disequilibrium (P < 0.00001; n = 1,026). This linkage disequilibrium is explained by an increased frequency of the −62A→C914 and G-62→914T over the G-62→C914 and −62A→914T haplotypes; hence, the mutant allele at each locus appeared to be in partial linkage disequilibrium with the wild-type allele at the other. GPR10 haplotypes were constructed; however, on account of the rarity of the 914T allele, haplotypes including this allele were insufficiently common in the population to permit analysis. Therefore, haplotype analysis did not provide any additional information over and above the results obtained from the analysis of the two SNPs separately.
Neither polymorphism showed any association with BMI (Table 2), fasting glucose, insulin, triglycerides, or cholesterol (data not shown). However, significant associations between C914T and diastolic blood pressure (P < 0.01) and between G-62A and C914T and systolic blood pressure (P < 0.05) were found (Table 2). Blood pressure was higher in carriers of the −62A allele than in noncarriers. Similarly, those who were homozygous for the C914 allele had higher blood pressure readings than carriers of the 914T allele. These findings are consistent with the observed pattern of linkage disequilibrium between these two SNPs.
The ability of the variant receptor P305L to generate intracellular calcium in response to a range of PrRP concentrations (5) was examined using fluorometric imaging plate reader (FLIPR) technology applied to stably transfected HEK293 cells. The naturally occurring mutant receptor was compared with both its wild-type counterpart and a negative control (an artificially mutated form of the receptor lacking its COOH-terminal portion [H306STOP]) (Fig. 1). The P305L mutation resulted in a significant (P < 0.001) shift to the right in ligand-induced calcium flux (half-maximal effective dose [95% CI]: 2.2 × 10⁻⁹ mol/l PrRP [1.7 × 10⁻⁹ to 2.8 × 10⁻⁹] for the wild type [P305] vs. 1 × 10⁻⁸ mol/l PrRP [9.2 × 10⁻⁹ to 1.1 × 10⁻⁸] for the mutant receptor [305L]). Responses at maximally effective ligand concentrations were not significantly different. Comparable results were obtained when the shorter form of the ligand, PrRP-20 (Phoenix Pharmaceuticals, Belmont, CA) was used (data not shown). Preliminary experiments suggest that there are no major differences in ligand binding between the naturally occurring mutant and wild-type forms of the receptors (C.S., P.C., J.B., personal observations).
The failure to detect pathogenic mutations within GPR10 and PrRP in subjects with severe obesity or associations between polymorphisms in GPR10 and BMI does not exclude a role for these molecules in appetite regulation. It is unlikely, however, that genetic variation in these molecules is responsible for a substantial proportion of human obesity.
The associations found between GPR10 polymorphisms and blood pressure are intriguing and deserve further study in independent populations. How might PrRP/GPR10 influence blood pressure? PrRP elevates blood pressure when administered ICV (2). PrRP is highly expressed in areas of the brain known to be important in the control of cardiovascular function, most notably the A1 and A2 areas of the caudal medulla, where PrRP immunoreactive neurones strongly costain with tyrosine hydroxylase (6). GPR10 is encoded on human chromosome 10q25.3–q26.1 (7). While this is not a region that has been implicated in major genome-wide scans in human hypertension, it is notable that there is a major quantitative trait locus for blood pressure in rats on chromosome 1, in the region syntenic to human 10q25–26.
We conclude that genetic variation in the G-protein-coupled receptor GPR10 may have an influence on human blood pressure. As is always the case with observations of this nature, replication studies in other large populations is a priority to determine the consistency of the genetic association.
RESEARCH DESIGN AND METHODS
Study populations.
A subset of 94 unrelated individuals subselected from a larger cohort of children affected by severe early-onset obesity (8) were used in the initial mutation screen. In all probands within this cohort, obesity arose before 10 years of age and BMI was >4 SDs above the population mean for their sex and age. Subselection of our study set was performed on a variety of criteria, including documented evidence of a family history of obesity, hyperphagia, and consanguinity. Individuals were excluded if there was evidence of a recognized clinical syndrome, known monogenic syndromic basis, or structural cause for their obesity.
The MRC Ely Study is a prospective population-based cohort study of the etiology and pathogenesis of type 2 diabetes and related metabolic disorders (3,4). It is an ethnically homogeneous Caucasian population in which phenotypic data have been recorded on individuals both at the outset and after 4.5 years. All subjects were between 40 and 65 years of age at baseline. This cohort was recruited from a population sampling frame with a high response rate (74%), making it representative of the general population for this area of Eastern England. Of the 1,084 individuals studied, 29 (2.7%) had previously undiagnosed diabetes and 165 (15.2%) impaired glucose tolerance.
Genetics.
Genes were amplified from genomic DNA by PCR. Genomic DNA was isolated from whole blood using a QIAamp blood kit (Qiagen, London). PCR was performed using BioTaq (Bioline, London) and carried out as recommended by the manufacturer. Thirty-five cycles (30 s at 96°C, 40 s at 60°C, and 40 s at 72°C) were performed using a PTC-225 Peltier Thermal Cycler (MJ Research, Watertown, MA).
Following digestion, gel electrophoresis was performed using 3% (wt/vol) agarose gels (Gibco BRL, Paisley, U.K.) containing ethidium bromide and the pattern of bands were visualized and recorded after exposure of the gel to ultraviolet radiation. Sequencing was carried out using BigDye terminator chemistry (Perkin-Elmer, Beaconsfield, U.K.) and electrophoresed on an ABI 377 automated DNA sequencer (Perkin-Elmer, Foster City, CA). G-62A was genotyped by PCR amplification of the fragment containing this polymorphism, followed by digestion with the restriction enzyme BstN I (New England Biolabs, London), according to the manufacturer’s protocol. C914T was also typed following generation of a forced restriction enzyme site. Digestion of the PCR product was performed with the restriction enzyme SacI (New England Biolabs). The primers used in the PCR and sequencing and genotyping reactions are listed in the online appendix (http://diabetes.diabetesjournals.org).
Functional analysis of GPR10 variant.
An expression construct was formed by cloning the human GPR10 receptor cDNA into pcDNA 3.1 (Stratagene, La Jolla, CA). After verification by direct sequencing of the clone, mutagenesis of the construct to yield the 305L and 306STOP GPR10 receptor mutants was performed using the Quick Change site-directed mutagenesis kit (Stratagene) following the manufacturer’s protocol. HEK 293 cells were transfected with each of these three constructs using Lipofectamine (Gibco-BRL), as recommended by the manufacturer, and incubated in G418 (Gibco-BRL)-containing media for 4 weeks.
Clones (>100) derived from each transfection were pooled into populations and incubated in varying concentrations of PrRP and tested for differences in their intracellular signaling capacity through GPR10 using the FLIPR, as described (9). Each concentration of ligand was tested in quadruplicate. Briefly, cells were plated out in cell media (DMEM, 10% [vol/vol] FCS, 1% [vol/vol] penicillin/streptomycin, 1% [vol/vol] glutamine, and 1 mg/ml G418 [Gibco-BRL]) at 50,000 cells/well in Biocoat poly d-lysine 96-well black/clear plates (Fred Baker, Runcorn, U.K.) 24 h before use. Cells were incubated overnight at 37°C in a humidified tissue culture incubator set at 37°C in 5% CO2. One hour before beginning the assay, the cells were loaded with 100 μl assay buffer (HBSS, 0.02 mol/l HEPES, 1 μg/ml BSA, 2 mmol/l CaCl2, and 75 μg/ml probenecid, pH 7.4) (Sigma, St. Louis, MO) containing 0.2% (vol/vol) Fluo-4 AM and 0.2% (vol/vol) pluronic acid (Molecular Probes, Eugene, OR) and then placed back in the tissue culture incubator. Cells were then washed three times with 200 μl of assay buffer, leaving 100 μl residual volume after the final wash. PrRP-31 (Phoenix Pharmaceuticals) was made up at three times the required final test concentration in 100 μl assay buffer in a 96-well plate. Test plate fluorescence was then measured by the FLIPR every second for 10 s before adding PrRP-31. Fluorescence was measured every second for a further 80 s. PrRP-31 was added in a volume of 50 μl. The maximum change in fluorescence in each well measured between 10 and 80 s was corrected for the baseline fluorescence measured over the first 10 s before addition of test PrRP-31. This baseline fluorescence is dependent on cell number and dye loading efficiency and is therefore a reasonable means by which to normalize the data.
Statistical methods.
Linkage disequilibrium test and haplotype analyses were performed using the expectation-maximization algorithm. Association analyses between the genotype and the phenotype were performed using the MIXED procedure in the Statistical Analysis System (SAS for Windows, version 8.2); this allows incorporation of unbalanced repeated data, which improves the power of the study. Means were adjusted for age and sex when BMI was the outcome and for age, sex, and BMI when blood pressure was the outcome. Statistical significance was determined in the G-62A genotype by comparing the means for each of the three genotype groups. For the C914T genotype, only two genotype groups existed; therefore, the P value reflects the difference between these two groups.
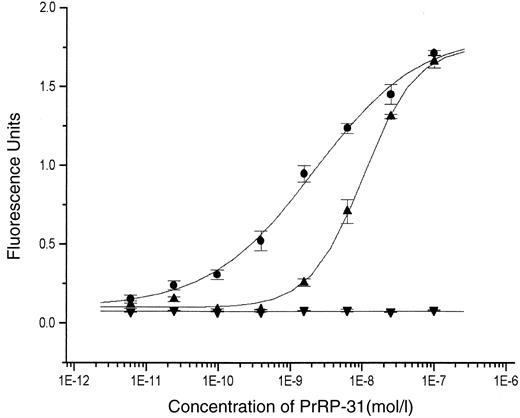
HEK 293 cells were transiently transfected with cDNAs expressing either wild-type (•), P305L (▴), or H306STOP (▾) GPR10, and receptor activation in response to increasing concentrations of PrRP was assessed by FLIPR technology as described in research design and methods. The results shown represent the means ± SD of three independent experiments.
HEK 293 cells were transiently transfected with cDNAs expressing either wild-type (•), P305L (▴), or H306STOP (▾) GPR10, and receptor activation in response to increasing concentrations of PrRP was assessed by FLIPR technology as described in research design and methods. The results shown represent the means ± SD of three independent experiments.
Variant sequences in PrRP and GPR10 found in 94 unrelated subjects with severe early-onset obesity
| Gene | Polymorphism (nucleotide) | Coding change (amino acid) | Type of change | Allele frequency |
|---|---|---|---|---|
| GPR10 | G-62A | Noncoding | — | 23% |
| G-37C | Noncoding | — | 1% | |
| G285A | T95T | Silent | 8% | |
| C648A | G216G | Silent | 1% | |
| A747C | S249S | Silent | 2% | |
| G847A | V283I | Conservative | 1% | |
| C914T | P305L | Nonconservative | 7% | |
| C1036T | L346L | Silent | 1% | |
| PrRP | G-83A | Noncoding | — | 1% |
| Cintron*268T | Noncoding | — | 1% | |
| G183A | G61G | Silent | 1% | |
| C+8A | Noncoding | — | 6% |
“-number,” number of base pairs upstream of the start codon at which the polymorphism occurs; “intron
number,” number of bases along the intron at which the polymorphism occurs; “+number,” number of base pairs downstream of the stop codon at which the polymorphism occurs.
Relationship between genotype at G-62A and C914T (within GPR10) and obesity- and cardiovascular-related phenotypes in a U.K. Caucasian population
| Phenotype | P value, adjusted for | |||||||
|---|---|---|---|---|---|---|---|---|
| G/G (wild type) | G/A | A/A | Age, sex | Age, sex, BMI | ||||
| G-62A | ||||||||
| n (observations) | 581 (1,033) | 382 (695) | 63 (114) | |||||
| BMI (kg/m2) | 26.46 ± 0.19 | 26.25 ± 0.22 | 26.63 ± 0.41 | 0.778 | — | |||
| Diastolic blood pressure (mmHg) | 77.28 ± 0.38 | 78.27 ± 0.46 | 79.76 ± 1.25 | — | 0.169 | |||
| Systolic blood pressure (mmHg) | 127.09 ± 0.59 | 128.48 ± 0.70 | 133.80 ± 1.98 | — | 0.017 | |||
| Phenotype | Significance, adjusted for | |||||
|---|---|---|---|---|---|---|
| C/C (wild type) | C/T and T/T | Age, sex | Age, sex, BMI | |||
| C914T | ||||||
| n (observations) | 1,004 (1,807) | 80 (142) | ||||
| BMI (kg/m2) | 26.39 ± 0.14 | 25.85 ± 0.40 | 0.245 | — | ||
| Diastolic blood pressure (mmHg) | 78.20 ± 0.29 | 74.90 ± 0.90 | — | 0.008 | ||
| Systolic blood pressure (mmHg) | 128.55 ± 0.46 | 123.95 ± 1.33 | — | 0.023 | ||
Data are adjusted arithmetic means ± SD. n is the total number of individuals who were genotyped. The number of observations refers to the measures of phenotype, which in most cases were recorded at baseline and then again at follow-up.
Article Information
This work is supported, in part, by grants from the U.K. Medical Research Council (to S.O. and N.J.W.).
REFERENCES
Address correspondence and reprint requests to Stephen O’Rahilly, University of Cambridge, Departments of Medicine and Clinical Biochemistry, Box 157, Addenbrooke’s Hospital, Hills Road, Cambridge, CB2 2QQ, U.K. E-mail: sorahill@hgmp.mrc.ac.uk.
Received for publication 9 December 2002 and accepted in revised form 10 February 2003.
Additional information for this article can be found in an online appendix at http://diabetes.diabetesjournals.org.
FLIPR, fluorometric imaging plate reader; ICV, intracerebroventricular; PrRP, prolactin-releasing peptide.