
Dimension reduction helps to visualize high-dimensional datasets. These tools should be used thoughtfully and with tuned parameters. Sometimes, these methods take a second thought.

A naked-eye stare at one’s data can be the start of data analysis. But to present visualizations of data to others in a talk or a paper will take more than that. To find and render visually meaningful patterns in genetic and genomic data mountains, a researcher will likely turn to a class of class of statistical and computational tools for dimension reduction1,2,3,4,5. As the genetics field and its datasets have mushroomed, data visualization tools with dimension reduction algorithms have become widely adopted. But some say the tools distort and mislead.
Principal component analysis (PCA), t-distributed stochastic neighbor embedding (t-SNE) and uniform manifold approximation and projection (UMAP) are among the tools life scientists turn to for dimension reduction. Such tools “can act as either a blessing or a curse in understanding the geometric and neighborhood structures of datasets,” note the authors of a paper describing dimension reduction tools4. In some instances, they say, t-SNE can create spurious clusters that mislead researchers. Both t-SNE and UMAP “perform beautifully in preserving local structure but struggle to preserve global structure.”
Sharp criticism of a UMAP figure in a recent Nature paper6 has re-triggered a long-standing discussion of these methods. Here, some researchers explain why a revision of the figure is needed. They also speak about why passion levels about dimension reduction methods run high and how to use these methods in better ways.
Know your dimensions
Biostatistician Rafael Irizarry from the Harvard T.H. Chan School of Public Health and Dana-Farber Cancer Institute dislikes many of the t-SNE and UMAP plots he sees. They offer little of value to a paper, he says, and the output from these tools is analytically intractable. “I sometimes call them an artistic rendition of the data,” he says of t-SNE and UMAP plots. They lack confidence measures and indications of how much uncertainty rests inside their visually neat data clusters.
PCA, t-SNE and UMAP reduce dimensions from a large number to a more manageable one, he says. For single-cell RNA sequencing (scRNA-seq) data, t-SNE and UMAP are often used to reduce data to two dimensions to enable plotting in papers and on slides. To highlight clusters, t-SNE and UMAP are preferred over PCA because high-dimensional datapoints that are close become “really close in the two final dimensions.” That leaves room to separate groups out. PCA is used first because it accelerates t-SNE and UMAP, which can be very slow with 20,000 dimensions, he says. Thus, many scRNA-seq analysis pipelines first reduce data dimensions with PCA to compress dimensions, say, to between 30 and 100. Then t-SNE or UMAP are run. Sure, t-SNE and UMAP are “really powerful, useful tools,” says Irizarry, and scientists should keep using them for data clustering. The output can hint at discrete clusters in a researcher’s high-dimensional data. But scientists should not rely solely on them and, he says, what must certainly cease is the widespread, misguided use of these tools in genomics.
It’s a valid concern, says University of California, Los Angeles (UCLA) researcher Jingyi Jessica Li, who works at the interface between statistics, data science and genomics, about misguided use and how intractable t-SNE and UMAP data visualizations can be. In her view, users must not choose parameter settings to “find the thing I am looking for,” she says, and thus be guilty of confirmation bias. Parameters need to be selected in justified and appropriate ways. To do so takes keeping in mind what these tools do and considering what the dimensions are of datasets one might juggle.
Says Li, in population genetics, researchers might measure one million SNPs in 100 individuals, which is a high-dimensional data pile. Separately, if a research team collects data in a large group of individuals but collects only race, gender and age data, that’s three data dimensions and thus lower-dimensional data. High-dimensional data, says University of Tübingen data scientist Dmitry Kobak, can involve only one data modality, such as expression measurements of 20,000 human genes in many single cells. A table with gene expression data on 20,000 human genes in many cells is unwieldy to look at.
One can reduce the data’s dimensions with PCA, a linear approach, says Irizarry. If, for example, two genes are correlated and have the same or close to the same measured gene expression, PCA will average those two numbers and carry one forward. “It’s a combination of compression and also a signal-to-noise improvement.”
“PCA doesn’t know any biology,” says Irizarry. It finds the linear combinations that maximize data’s variance in the first principal component (PC). The second PC maximizes variance that is not accounted for in the first PC. This continues with the third, fourth and fifth PCs, as the algorithm finds the linear combination that maximizes variability not accounted for by the other PCs. PCA-based dimension reduction will improve the speed at which a computer can chew through data analysis and, when done right, can remove some noise in the data. t-SNE and UMAP are nonlinear approaches for dimension reduction. Output with these methods is not in and of itself a confirmation of findings, and data are lost as one reduces dimensions.
As California Institute of Technology researchers Lior Pachter and Tara Chari point out5, given the high dimensionality of genomic datasets, dimensionality reduction is useful to filter noise, make computational analysis tractable and enable exploratory data analysis. The aim is to preserve and extract local or global structure in the data and make biological inferences. Because these methods can induce distortions, they note that “it is preferable to limit dimensionality reductions” and prefer targeted analyses that lead to “focused visuals.”
Kobak and his colleague Philipp Berens, who were interviewed jointly, know that some recommend avoiding a UMAP or t-SNE plot. They disagree with this view. Kobak agrees, though, that these plots can mislead. Of the output of t-SNE or UMAP, “it’s not the end, it’s the beginning of the analysis,” he says.
It’s a human trait to want to group data, trends and experiences, says Genevieve Wojcik, a genetic epidemiologist at Johns Hopkins Bloomberg School of Public Health. When using such dimension reduction tools, one should consider whether the grouping is relevant to the scientific question being pursued. “Every analytical decision you make is still led by your assumptions,” she says. “There’s no one truth underlying every dataset.”

Learn the tough lessons
Revision of a figure in a Nature paper6 authored by the US National Institutes of Health (NIH) All of Us Research Program Genomics Investigators and published in February 2024 is underway. As of press time, the revision is not completed. The paper presents analysis data on nearly 250,000 study participants, including clinical-grade whole-genome sequence data. It tallies more than 275 million previously unreported genetic variants and explores the potential associations between genotypes and nearly 120 diseases. The figure in revision is a UMAP representation of All of Us whole-genome sequencing PCA data and shows the proportion of genetic ancestry per individual in the study in terms of six ancestry groups.
After publication, a number of researchers criticized this figure on social media. Later in February, a statement attributed to All of Us CEO Josh Denny notes that the social constructs of self-identified race and ethnicity are frequently conflated with genetic similarity. According to the statement, “The attempt in the study to represent both genetic similarities and self-identified race and ethnicity in Fig. 2 raised this concern.” At the NIH All of Us Researchers Convention in early April, Denny said the figure is being revised because it “didn’t follow our best guidelines.” There was rightful criticism of this figure and the plan is to address that “this was a mistake.”
Denny mentioned in this context that NIH All of Us co-funded and co-authored a previously published report7 in this area entitled Using Population Descriptors in Genetics and Genomics Research: A New Framework for an Evolving Field that was published by the National Academies of Sciences, Engineering, and Medicine (NASEM).
Wojcik, who was involved in compiling the NASEM report, is heartened by the response to the figure and the reaction by the All of Us researchers, whom she has found to be particularly mindful of best practices related to diversity, genetics, multi-omics and health information. Self-identified race and ethnicity have their place in population genetics as valid constructs. But these descriptors do not capture genetic aspects; they are social constructs.
In her view, the response and criticism about this figure show how the field of human genetics has changed. Awareness is heightened about the harms that standard practices can cause. But the incident also shows how much longer it takes to change the methods researchers use. “I don't think there’s anything inherently bad about UMAP,” she says, but scientists need to make decisions about the points they wish to visually present. In this instance, they sought to show how diverse the study’s population is. The data visualization choice is, however, that “in order to show diversity, you need to show separateness,” she says. That’s problematic, as is the way the algorithm is used to show six source populations. It plots the proportion of the participants’ genomes that look most like one of those six.
The category “Hispanic” means people have origins where Spanish is spoken, but “genetically speaking it doesn’t really mean that much,” she says. Nor does subdividing all Asian populations into just a few groups. People do not fall into neat clusters, she says. When using clustering algorithms, she says, researchers will want to check whether such clusters will propel their scientific questions and, as they do so, examine their assumptions about their methods decisions. More reflection about these decisions will improve population genetics and the field of human genetics overall.
Says Aravinda Chakravarti, he has heard about the figure revision but has no details. Chakravarti directs the Center for Human Genetics and Genomics at New York University’s Grossman School of Medicine and co-chaired the NASEM report along with Charmaine Royal at Duke University. Beyond correcting the long-standing practice in biomedicine of ignoring non-majority groups, Chakravarti is looking forward to discussions on how best to represent diversity in studies. Investigators “have to internalize the committee’s recommendations,” he says, and use them to make choices about methods and population descriptors.
Don’t forget to tune
With dimension reduction methods, says Berens, it’s advisable to consider the math of these methods, keep in mind which properties of the data they keep, and learn “what they’re good at and what they’re bad at.” Such insight helps users make informed choices when working with these methods. When scientists decide what their clustering will emphasize about their data, they should remember there is interaction among the data, one’s prior beliefs and analytic choices made, he says.
PCA, says Berens, is a linear transformation with well understood mathematical properties. But looking at a chart of many plotted PCs is challenging. As humans, we prefer two dimensions for exploratory data analysis, he says. Such explorations can reveal surprising facets that were previously missed, says Kobak, but they need further confirmation. Data visualizations from dimension reduction methods are not biological findings. One cannot use them as if to say, says Kobak, “I see this — full stop — end of story, end of paper.”
Kobak and Berens assessed8 a large-scale scRNA-seq dataset in a published study, in which they find that a t-SNE plot was not optimally generated. But, they say, when it was generated, less was known about how to apply t-SNE to such large datasets. Since then, researchers have learned more about setting parameters to better use dimension reduction to visualize large scRNA-seq datasets.
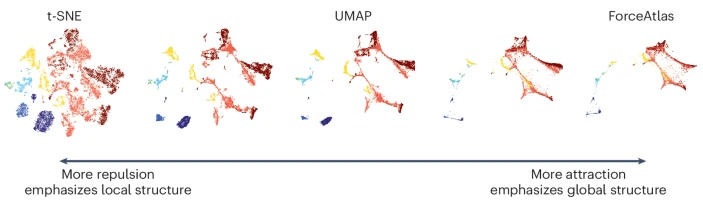
Among the parameters to care about, say Berens and Kodak, are perplexity and learning rate, which influence how the algorithms run and shape the resulting clusters. Both t-SNE and UMAP position neighbors closely, “but they do so a bit differently,” says Kobak. UMAP tends to produce more compact clusters than t-SNE. Another algorithm, called ForceAtlas2, has also become popular in single-cell transcriptomics. Even with the same data these methods can lead to different clusters.
Dimension reduction methods such as t-SNE and UMAP represent data in k-nearest neighbors graphs. Conceptually, postdoctoral fellow Sebastian Damrich and PhD student Jan-Niklas Böhm, along with Berens and Kobak, have found that each point sits in a kind of force field. In a paper9 and in other work, the team shows that these methods are in a continuum on an attraction–repulsion spectrum. Changing the balance between these forces alters the clustering. Some tunings preserve local structures more; others preserve global structures better. In a sense, says Kobak, there is no one t-SNE or UMAP. “You can move between them,” he says, almost as if it were one algorithm with a tuning knob. What’s useful about this is that a researcher can — by tuning the parameter of exaggeration — see fine structure with t-SNE. UMAP and ForceAtlas2 might be better suited to exploring the more global structure of that dataset. One might also choose to look at a number of plots from multiple dimension reduction tools and compare data representations and clustering processes, some of which will compress data more, others less. “We advocate looking at this entire spectrum,” says Berens. That assessment can be part of an exploratory data analysis. They can ‘turn the knob’ to see how clustering changes, says Kobak. It’s a bit like swapping objectives in a microscope, but unlike microscopy, these are not actual data but nonlinear transformations of data.
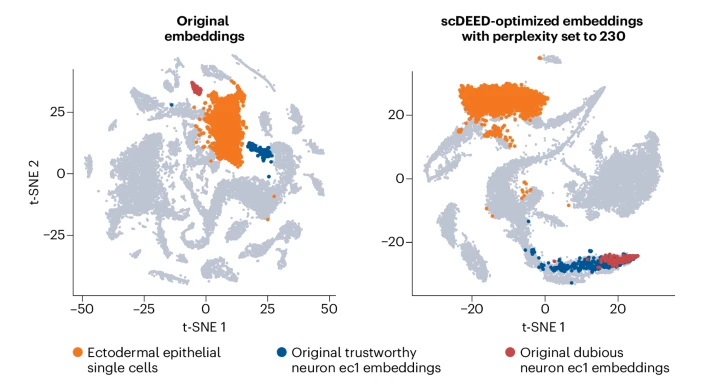
UCLA researcher Li also highlights the importance of parameter settings when using dimension reduction methods. With t-SNE or UMAP, some researchers might just use the default settings, but “the default may not be optimal for your data,” says Li. With t-SNE, one parameter to heed, in her view, is perplexity, and with UMAP there are two so-called hyperparameters. Depending on parameter settings, data can be represented in tighter or looser clusters. “Which one would you trust?” she asks. When researchers use these tools to draw conclusions about their data related to a scientific hypothesis, she says, “then you need to be careful.” With a statistical method called single-cell dubious embedding detector (scDEED10) that she, her PhD student Christy Lee, and Lucy Xia at the Hong Kong University of Science and Technology developed, she hopes researchers will have an easier time with that trust question. The team noticed that after optimizing with scDEED, t-SNE and UMAP representations look more similar to one another than before.
ScDEED performs quality assessment of the data visualization to avoid what the team calls ‘dubious embeddings’ from dimension reduction techniques such as t-SNE and UMAP. The software calculates a ‘reliability score’ for each data point and thus is a way to assess how trustworthy neighboring points are that are represented in the data visualization. The tool assesses the ‘pre-embedding space’ generated in the PCA, which precedes the dimension reduction with t-SNE or UMAP.
Running scDEED can take a moment, “because we do have to just check different parameters,” says Christy Lee. Its runtime will depend on the computing setup and dataset size. It’s worth taking the time, since having more trust in one’s data visualization is bound to propel scientific conclusions, which might, for example, be a comparison of gene expression in tumor cells and healthy ones.
Statistics is on board
Says Irizarry, “I have this saying that the reward for collaborating with a good statistician is that you publish less and more slowly.” Although it might seem slower to some, being responsible about statistical analysis is actually not always slower, he says. Good statistical analysis is crucial for good science. Statistics methods have old, deep roots that the reach back to the early days of genetics research, and statisticians have long been present in genetics and genomics collaborations. Yet he remembers decades ago hearing some famous investigators voice versions of, ‘If I need statistics, then I did the experiment wrong’. Partly thanks to genomics advances, this no longer happens, he says.
Feuds over UMAP and t-SNE have quite some history and baggage, says Wojcik. These tools need thoughtful use, but the incentive structure in science, she says, is “just not set up for well-thought-out slow and methodical science.” Wider access to statistical methods and tools are a positive, as is increased reflection when pursuing a given scientific question about whether a method is a good choice. “It’s not productive to demonize a method,” such as UMAP or t-SNE, she says. “It’s just math.” What matters, she says, is “how humans use it.”
References
Price, A. L. et al. Nat. Genet. 38, 904–909 (2006).
Lever, J., Krzywinski, M. & Altman, N. Nat. Methods 14, 641–642 (2017).
Moon, K. R. et al. Nat. Biotechnol. 37, 1482–1492 (2019).
Wang, Y., Huang, H., Rudin, C. & Shaposhnik, Y. J. Mach. Learn. Res. 22, 1–73 (2021).
Chari, T. & Pachter, L. PLOS Comput. Biol. 19, e1011288 (2023).
All of Us Research Program Genomics Investigators. Nature 627, 340–346 (2024).
National Academies of Sciences, Engineering, and Medicine. Using Population Descriptors in Genetics and Genomics Research: A New Framework for an Evolving Field (National Academies Press, 2023); https://go.nature.com/44QB83N
Kobak, D. & Berens, P. Nat. Commun. 10, 5416 (2019).
Damrich, S., Klockow, M. V., Berens, P., Hamprecht, F. A. & Kobak, D. Preprint at bioRxiv https://doi.org/10.1101/2024.04.26.590867 (2024).
Xia, L., Lee, C. & Li, J. J. Nat. Commun. 15, 1753 (2024).
Author information
Authors and Affiliations
Corresponding author
Rights and permissions
About this article
Cite this article
Marx, V. Seeing data as t-SNE and UMAP do. Nat Methods 21, 930–933 (2024). https://doi.org/10.1038/s41592-024-02301-x
Published:
Issue Date:
DOI: https://doi.org/10.1038/s41592-024-02301-x