![How to Make an Interactive Infographic [+Templates]](https://visme.co/blog/wp-content/uploads/2023/11/How-to-Make-an-Interactive-Infographic-Quick-Guide-8-Customizable-Templates-Thumbnail-500x280.jpg)


How to Make Video Infographics: An Effortless Guide + 6 Video Infographic Templates
Infographics are excellent content formats and for many good reasons.
These visual tools excel at simplifying complex information and engaging audiences through striking visuals, making content easily digestible and comprehensible.
But here's the deal: sticking to static infographics won't always cut it. Everyone's churning those out daily. To truly captivate your audience and provide an exceptional learning experience, you need interactive infographics.
These interactive versions offer heightened engagement compared to static infographics. They bring an immersive dimension to the medium, improving audience involvement.
In this article, we’ll be delving into how to create an interactive infographic. We’ll also share some templates and Visme’s features that’ll help you create an impactful one.
An interactive infographic is a digital visual representation of information that allows users to engage with the content. It combines the strengths of static infographics with interactive elements that make the information more engaging and easily understandable.
These interactive elements could include clickable links, illustrations, animations, hover effects, embedded media, interactive charts and graphs, transition effects and more.
Interactive infographics are commonly used in digital publications, websites, or presentations to make complex information more accessible and enjoyable for audiences.
Follow the steps below to create interactive infographics in Visme.
To begin, log in or sign up for your Visme account at no cost. Simply input your email, name and password and you’ll be redirected to the dashboard.

Once you're in the Visme dashboard, tap the "Create" button located in the top left sidebar. This opens up access to Visme's extensive library of interactive infographics templates.
Browse through the infographics tab or utilize the search bar to explore different infographic categories or find specific templates based on your search query.
Additionally, if you prefer to start fresh, you can opt for a blank canvas to craft an entirely new design from scratch.

Adding interactivity to your infographics gives readers a more immersive and engaging experience. Whether you are editing a template or starting from scratch, Visme makes it easy to customize your infographic with interactive and animation elements.
To provide additional information or context to your infographic, you can link a text or object to a project you created on Visme or link to an external website.
To begin, choose the element (object, shape, text, or icon) you want to use as a "button" for the link. Next, navigate to the Actions menu located at the top right. Click Actions and access the External Link tab.
Click the dropdown to choose whether you want to link to a Visme Project, Website, Email Address or Social Media. Enter the URL, email and social media address, or pick the project you want to link to. You can also specify if the link should open in the Same Tab or in a New Tab. Then, click the “Apply” button to proceed.
Here’s a video showing how the feature works.
To achieve this, begin by choosing the object, shape, text, or icon you want to use as a "button" for the link. Then, access the "Actions" menu located at the top right corner. Within this menu, navigate to the "Slide or Page" tab. In the "Go to Slide" dropdown menu, simply choose the slide or page you want your selected object to link to. Once completed, click on "Apply" to finish the process.
To access animated graphics on Visme, navigate to the left toolbar and select "Graphics," then scroll slightly down to find the section dedicated to animated graphics.
You’ll find different elements to infuse life into your designs, including:
Remember, the same customization for every design element applies here as well. You can modify the color or size of any illustration, character, or gesture.
You can use the pre-made animated icons or animate static icons using the available animation tools.
Here’s how to animate static icons:
Access the graphics section on the left toolbar and select the desired icons.
Choose the animation style and duration for each icon, ensuring a balanced presentation without overwhelming the viewer.
A great way to inspire your audience to interact with your presentation is to add popups or hover effects that reveal additional information.
Here’s how you can do it:
Choose the desired object for the pop-up display in your infographic. Next, access the "Actions" button at the top right. Within the "Actions" menu, navigate to the "Hotspot" tab. In the "Hotspot" tab, select the pop-up content you want to link. Decide whether it triggers on click or hover. Complete the process by clicking the "Apply" button.
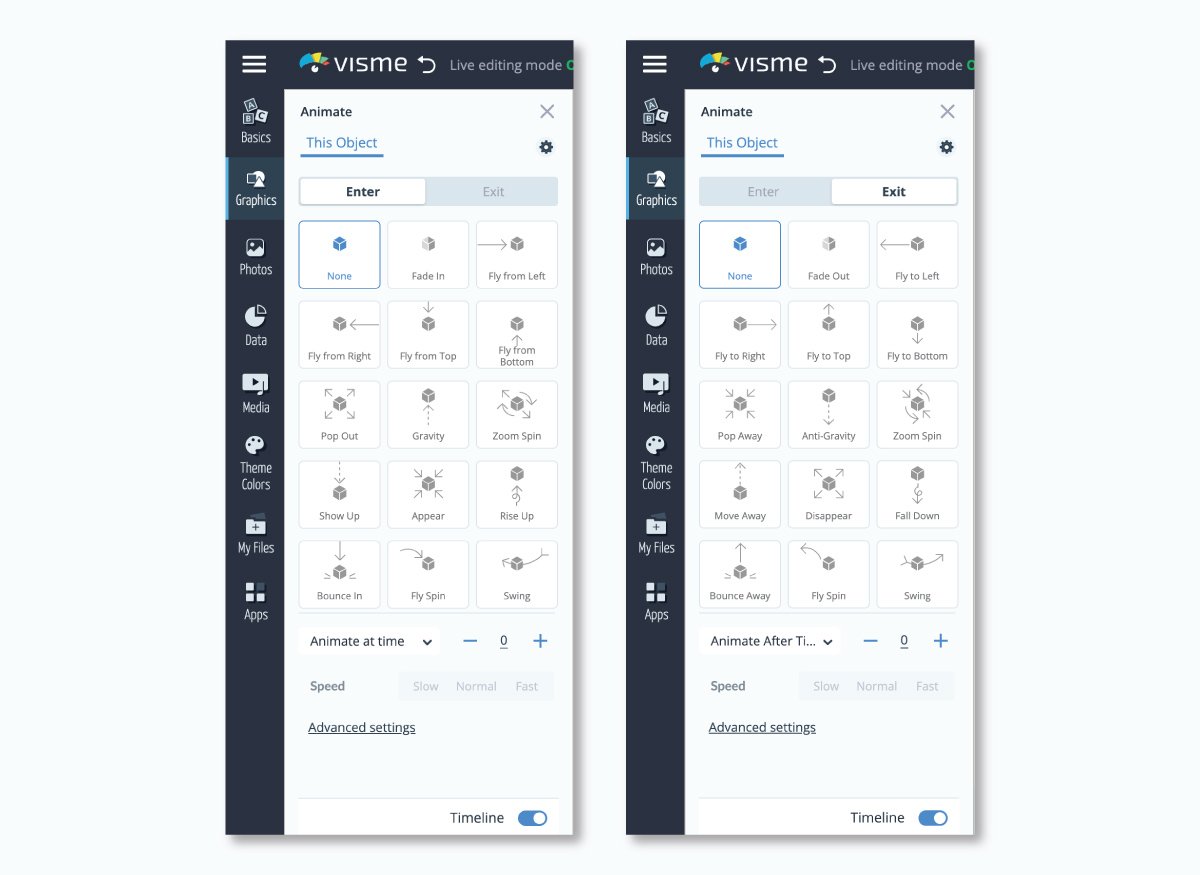
To animate an image, text box, or icon, select the item and go to Actions, then Animate to explore your choices. On the left side of the screen, you'll see a window that offers many options for your object to Enter and Exit your project. You’ll find 14 different types of enter and exit effects.
You can easily control when objects appear on stage by accessing the top left menu and selecting “Show objects” list to view and manage the timeline.
Preview your project to test the animations and ensure they are functioning as intended prior to publishing or sharing it.
You can convert any object into an interactive video or audio hotspot for your projects.
To do this:
You also have the choice to upload an existing video to the hotspot. The process remains consistent when incorporating an audio hotspot into your infographic. Simply follow the steps to either record your audio or upload an existing audio file to the hotspot.
Alternatively, you might choose to embed a video in your infographic.
To embed a video, utilize the Media or Apps tabs on the left sidebar in the editor. The Media tab lets you embed online content using URLs or iframe codes. The Apps tab also allows direct linking to video platforms like YouTube or Vimeo within Visme.
You can effortlessly convey intricate statistics and data in a visually captivating manner with Visme's diverse set of interactive charts, graphs, maps and other data visualizations.
With a range of animation types available, you can tailor your charts, graphs, or maps to seamlessly integrate into your project. For instance, you can enable chart values to appear as users hover over different elements, elevating the impact of your data visualizations.
While you can download your infographic in various formats, HTML5 preserves the animations and interactivity from the Visme editor in an offline format.
In addition, you can embed your infographic directly onto your website or blog post. If you would also like to share their projects online, you can generate a public and private link to do this.

We’ve put together 8 interactive infographic templates that you can easily customize to kickstart your creation.
But first, hear what one of our users has to say about his experience with our templates:
“Their pre-made designs have been tremendously helpful to both of my businesses - making it easier to have a design to start editing. Being able to create custom elements and grab the code to embed them into my websites has been very helpful as well!”
Sean | Web Designer & Digital Marketing Specialist
Utilize this environmentally friendly infographic to promote sustainable practices and raise awareness about the environment. It incorporates various shades of green to convey the theme and includes icons, charts, graphs and other visually engaging elements to elucidate key points.
Take this infographic to another level with interactive elements such as animated eco-friendly illustrations, characters or icons. You can also add clickable social media icons that direct to your social media platforms.

You can use the template’s sections to present a wealth of information including statistics, benefits and practical tips to encourage participation in eco-friendly initiatives.
Whether you're outlining business growth, development plans or organizational objectives, utilize this template to map out your vision. Infused with a spectrum of vivid colors and intuitive design elements, this infographic breathes life into your strategic vision.
Utilize the radial diagram, statistics section and text blocks to visually showcase long-term goals, milestones and actionable strategies. Elevate engagement by animating the human-like icons, captivating your audience and creating an immersive experience.

Enhance your narrative with clickable links embedded in text or icons, revealing supplementary data and business insights for a deeper dive into your content.
Align every element in this template with your brand identity. With Visme’s brand design tool, integrating your brand's colors, fonts and logos is a breeze. Simply input your URL and watch as the wizard seamlessly incorporates your website assets into your brand kit, ensuring consistent and on-brand designs effortlessly.
Elevate your company's story effortlessly and leave a lasting impression on your audience with this minimalistic but impactful infographic template.
The cream and blue color palette, paired with simple icons exudes a cool, professional aura. Take it up a notch by incorporating 3D icons, animated graphics and dynamic transitions to enhance its visual allure.

Leverage each section of the template to showcase your company's journey, milestones, achievements and future aspirations in a visually captivating manner.
This template was originally tailored for the culinary industry. However, its versatility extends to individuals and teams venturing into various business domains such as IT, marketing, fashion and more.
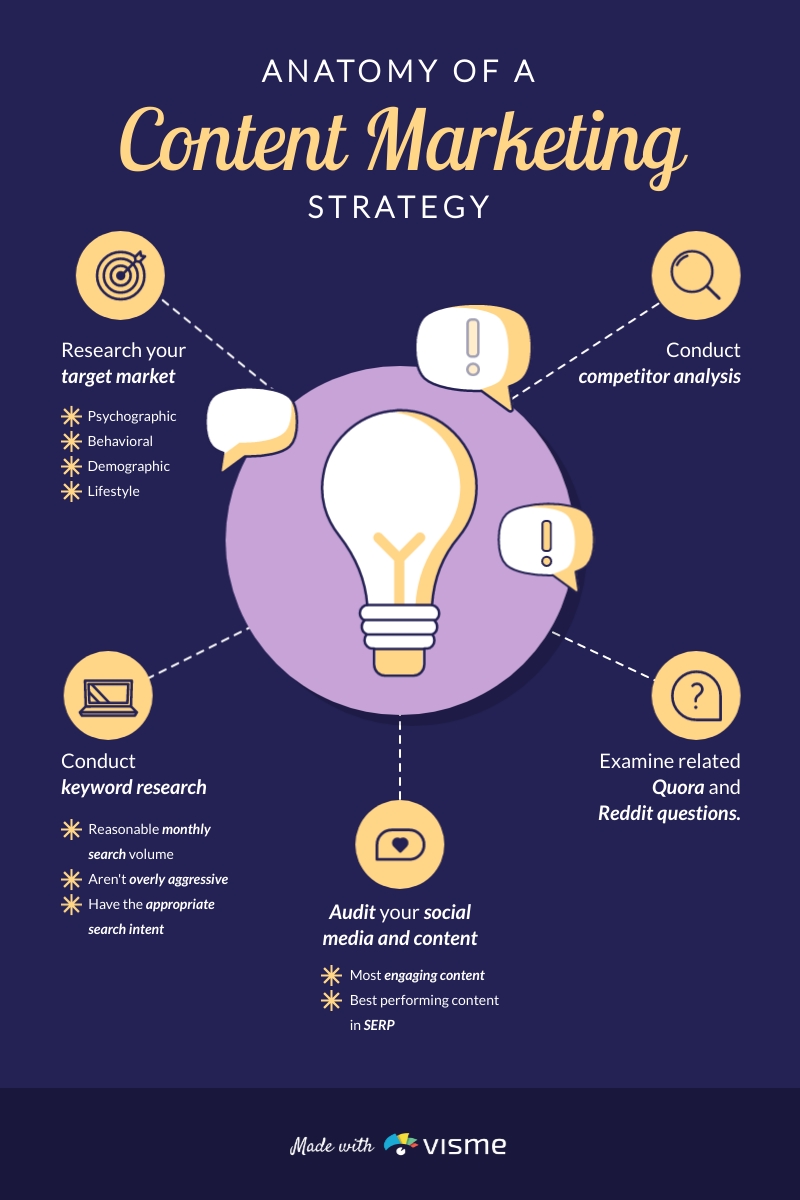
Crafting a winning marketing strategy is the backbone of every successful business. Use this template to guide your audience through the intricate process of building a robust and effective plan or strategy.
Filled with stunning visuals, custom icons and shapes, this template excels at illustrating crucial strategies in a visually compelling and impactful manner. Enhance comprehension of the concept you’re conveying by incorporating interactive media like videos, audio clips, or video and audio hotspots.
Craft personalized designs utilizing Visme's diverse array of stock photos, icons, widgets and design elements. If you can’t find the perfect visual, you can create one using Visme’s AI image generator. It generates unique photos, paintings, pencil drawings, 3D graphics, icons, abstract art and more in seconds.
Are you an educator, app developer, or ed-tech enthusiast preparing to launch a groundbreaking learning app? This comprehensive Learning App Feature Launch Roadmap Infographic will assist you.
The template reels readers in from the outset with stunning motion graphic effects and bright, vivid colors.
You can outline a comprehensive step-by-step roadmap for launching your learning platform, covering everything from initial ideation to seamless execution. The sections can be used to highlight user research, feature prioritization, development sprints, testing phases, post-launch analytics and more.

To enhance interactivity, viewers can be allowed to direct the pace by using the arrows on the right side. You can also use animated characters to emphasize crucial information.
For optimal sharing, you can share this interactive infographic via a live link or download it as an HTML5 format and embed it on your website.
With Visme's analytics features, you can track how your audience is engaging with or interacting with your infographic. You can access detailed insights like visit/view counts and duration spent, offering comprehensive information on their interaction patterns.
Streamline your website design process and present a comprehensive timeline with this sleek and adaptable infographic template.
It uses a crisp white background with captivating visuals, delivering a clean and clear look to showcase professionalism.
This template allows you to map out your website's development stages, from conception to launch, in a visually engaging format. You can easily highlight crucial milestones, deadlines, and key deliverables.
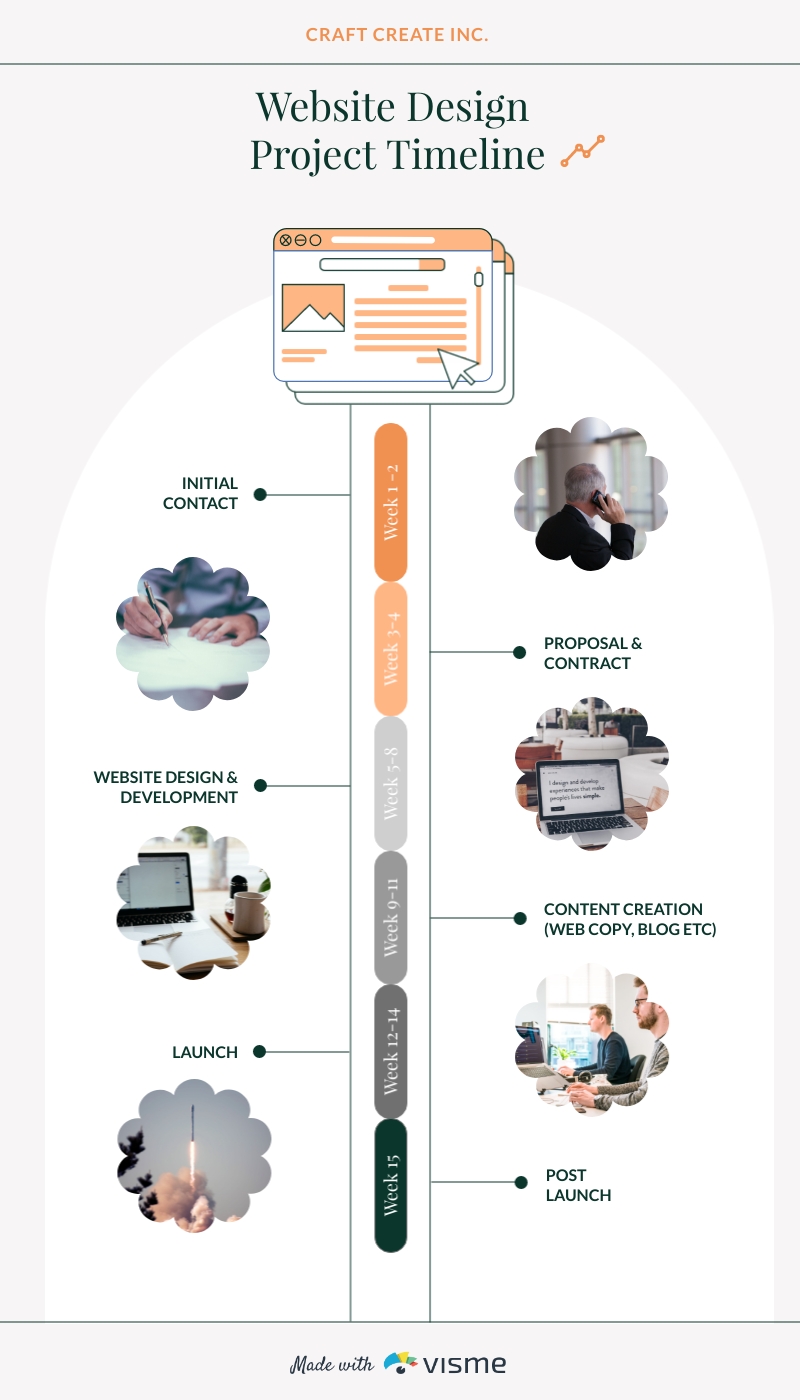
Enhance this template by incorporating visual prompts such as pop-ups or animated graphics.
Make use of Visme’s collaboration tool to co-create your project's progress and streamline smooth communication with your team members. Members of the team can communicate in real-time, assign tasks to one another, provide comments and grant access to certain functions inside the document.
Looking for a way to transform intricate data into a captivating visual story that hooks your audience? This template is your sure bet.
Its intuitive radial layout and vibrant design offer a dynamic and visually engaging way to showcase complex information effortlessly.
You can utilize this template to list steps and processes in your business, organize projects or marketing plans and simplify complex steps.
To boost engagement, consider animating icons and text or introducing a hovering arrow icon linked to extra information or answers within popups. Viewers can also access more details by clicking on icons next to each process or strategy name.

With Visme’s shortcut feature, locating any design element takes mere seconds. Simply tap the forward slash (/) to access a search bar to find whatever you require.
Level up your social media game with our dynamic Social Media Comparison Infographic template!
Whether you're a seasoned marketer or a budding influencer, this visually engaging tool empowers you to showcase the strengths, engagement metrics and unique features of various social media platforms.
The eye-catching colors, images and social media icons add depth and visual interest to your infographic.
You can compare different social media platforms side by side, highlighting their audience demographics, posting formats, engagement strategies and more.
To make your interactivity with data visualization, consider comparing each social media platform based on specific metrics. Chart values can dynamically appear as users hover over them, enhancing the viewer's experience.

If you require assistance with content ideas or refining your infographic's text, Visme's AI writer can help. This tool not only generates top-notch content but also acts as a meticulous proofreader, ensuring error-free and compelling writing. Simply input your prompts and you’ll generate your result in seconds.
Here are some best practices you should know when designing an interactive infographic:
Don’t stuff your infographic with interactive elements. That’s because an excess of interactive elements may overpower your audience and divert their focus away from crucial information.
Ask yourself: Does this interactive element contribute to the learner's understanding? If it doesn't, you may need to discard it.
Ensure each interactive component serves a distinct purpose in enriching understanding or fostering engagement.
Keep in mind that the aim is to utilize interactivity as a means to engage and enhance the content rather than overshadow or divert the reader from the primary information.
When your audience views your infographic, where does their gaze naturally gravitate? Are they navigating the infographic in a structured sequence, or does the information appear disorganized?
It's crucial to ensure the infographic's flow aligns logically, guiding individuals through the data and supporting points in a coherent manner. You should avoid complex navigation. Keep the user journey simple and intuitive, guiding them through the information seamlessly.
To accomplish this, arrange your elements in a sequential manner or employ tangible visual aids like lines, arrows, or other indicators to physically guide the reader through the intended path.
Maintain a cohesive visual aesthetic across the entire infographic. Employing a harmonious blend of color schemes, font types and icons makes your design memorable.
Avoid using different design elements at different parts of the infographic. For instance, if you introduce line icons, ensure their uniform usage throughout the entire visual composition for a seamless and polished design.
When selecting a color scheme, limit yourself to 2-3 colors at most and mirror this approach with your font choice. Use one font style for headers, another for subheadings and a different one for body text. This helps you maintain a clean and organized design.
Here are some benefits of using interactive infographics:
A static infographic typically combines text, images and graphics to convey a message. Viewers can see the data but not manipulate or interact with it.
On the other hand, an interactive infographic incorporates dynamic elements that enable users to engage with the content. Users can interact with the content, often by clicking, scrolling, hovering, or performing other actions that reveal additional information, animations, or data visualizations.
Here are some major types of infographics:
Here’s an example of an interactive infographic:
An infographic about a world map that reveals the name of each country when users hovers or can click on different parts of the map.

Visme is a versatile online tool that empowers users to create stunning interactive infographics. It offers a user-friendly interface with drag-and-drop functionality and a customizable template, making it accessible to beginners and professionals alike.
Users can add interactivity to their infographics using Visme's interactive features. This includes clickable elements, hover-over effects, pop-ups, embeddable media (such as video audio), animated graphics, animated data and more.
Visme also provides a vast library of interactive infographic templates and design elements. These templates cover various topics and styles, allowing users to start with a pre-designed layout and customize it as needed. Users can also access a wide range of features and customization options to bring their infographics to life in a dynamic format.
Creating interactive infographics is a great way to engage your audience and enhance comprehension by allowing them to explore data dynamically.
Visme is an all-in-one tool that allows you to craft captivating interactive infographics effortlessly. It offers a wide range of features, customization options and templates to bring your infographic to life in a dynamic format.
The platform's intuitive interface also simplifies the process of adding interactivity. Users can easily incorporate interactive elements into their infographics without requiring advanced technical skills.
Yet, creating infographics is not all you can do with Visme. You can also create presentations, reports, plans, training materials, brochures, whitepapers, case studies, videos and much more.
Sign up on Visme to start creating stunning and impactful infographics with our free infographic maker today.
Design visual brand experiences for your business whether you are a seasoned designer or a total novice.
Try Visme for free


About the Author
Olujinmi is a Content writer for Visme who creates human-first SEO content. She loves helping businesses smash their ROI goals with strategic content development and optimization. When she’s not writing, you’ll find her composing songs.