Sensei LMS offers drill-down reporting for you to see how learners are progressing across all courses, lessons, and quizzes. To access this area, go to Sensei LMS > Reports.
Students Report
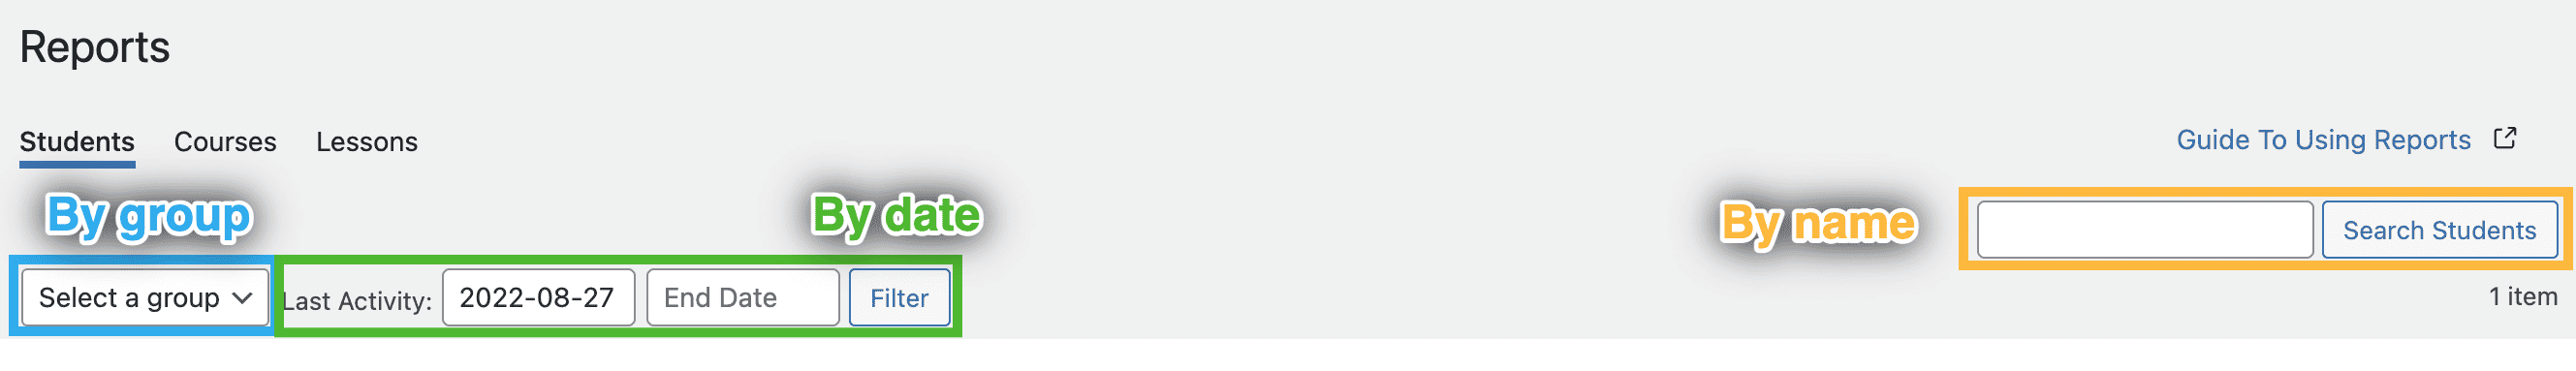
The default view of the Analysis page shows last month’s activity overview of your students and their statistics. All of this data can be exported to a CSV file for a more detailed examination in Google Docs, Excel, or your favorite spreadsheet tool. The Analysis page will also show several filters in order to facilitate searching for a student.
Filters
- By Group
- By Date / Last activity
- By Name
Please note: Reports will only show students that have activity recorded.
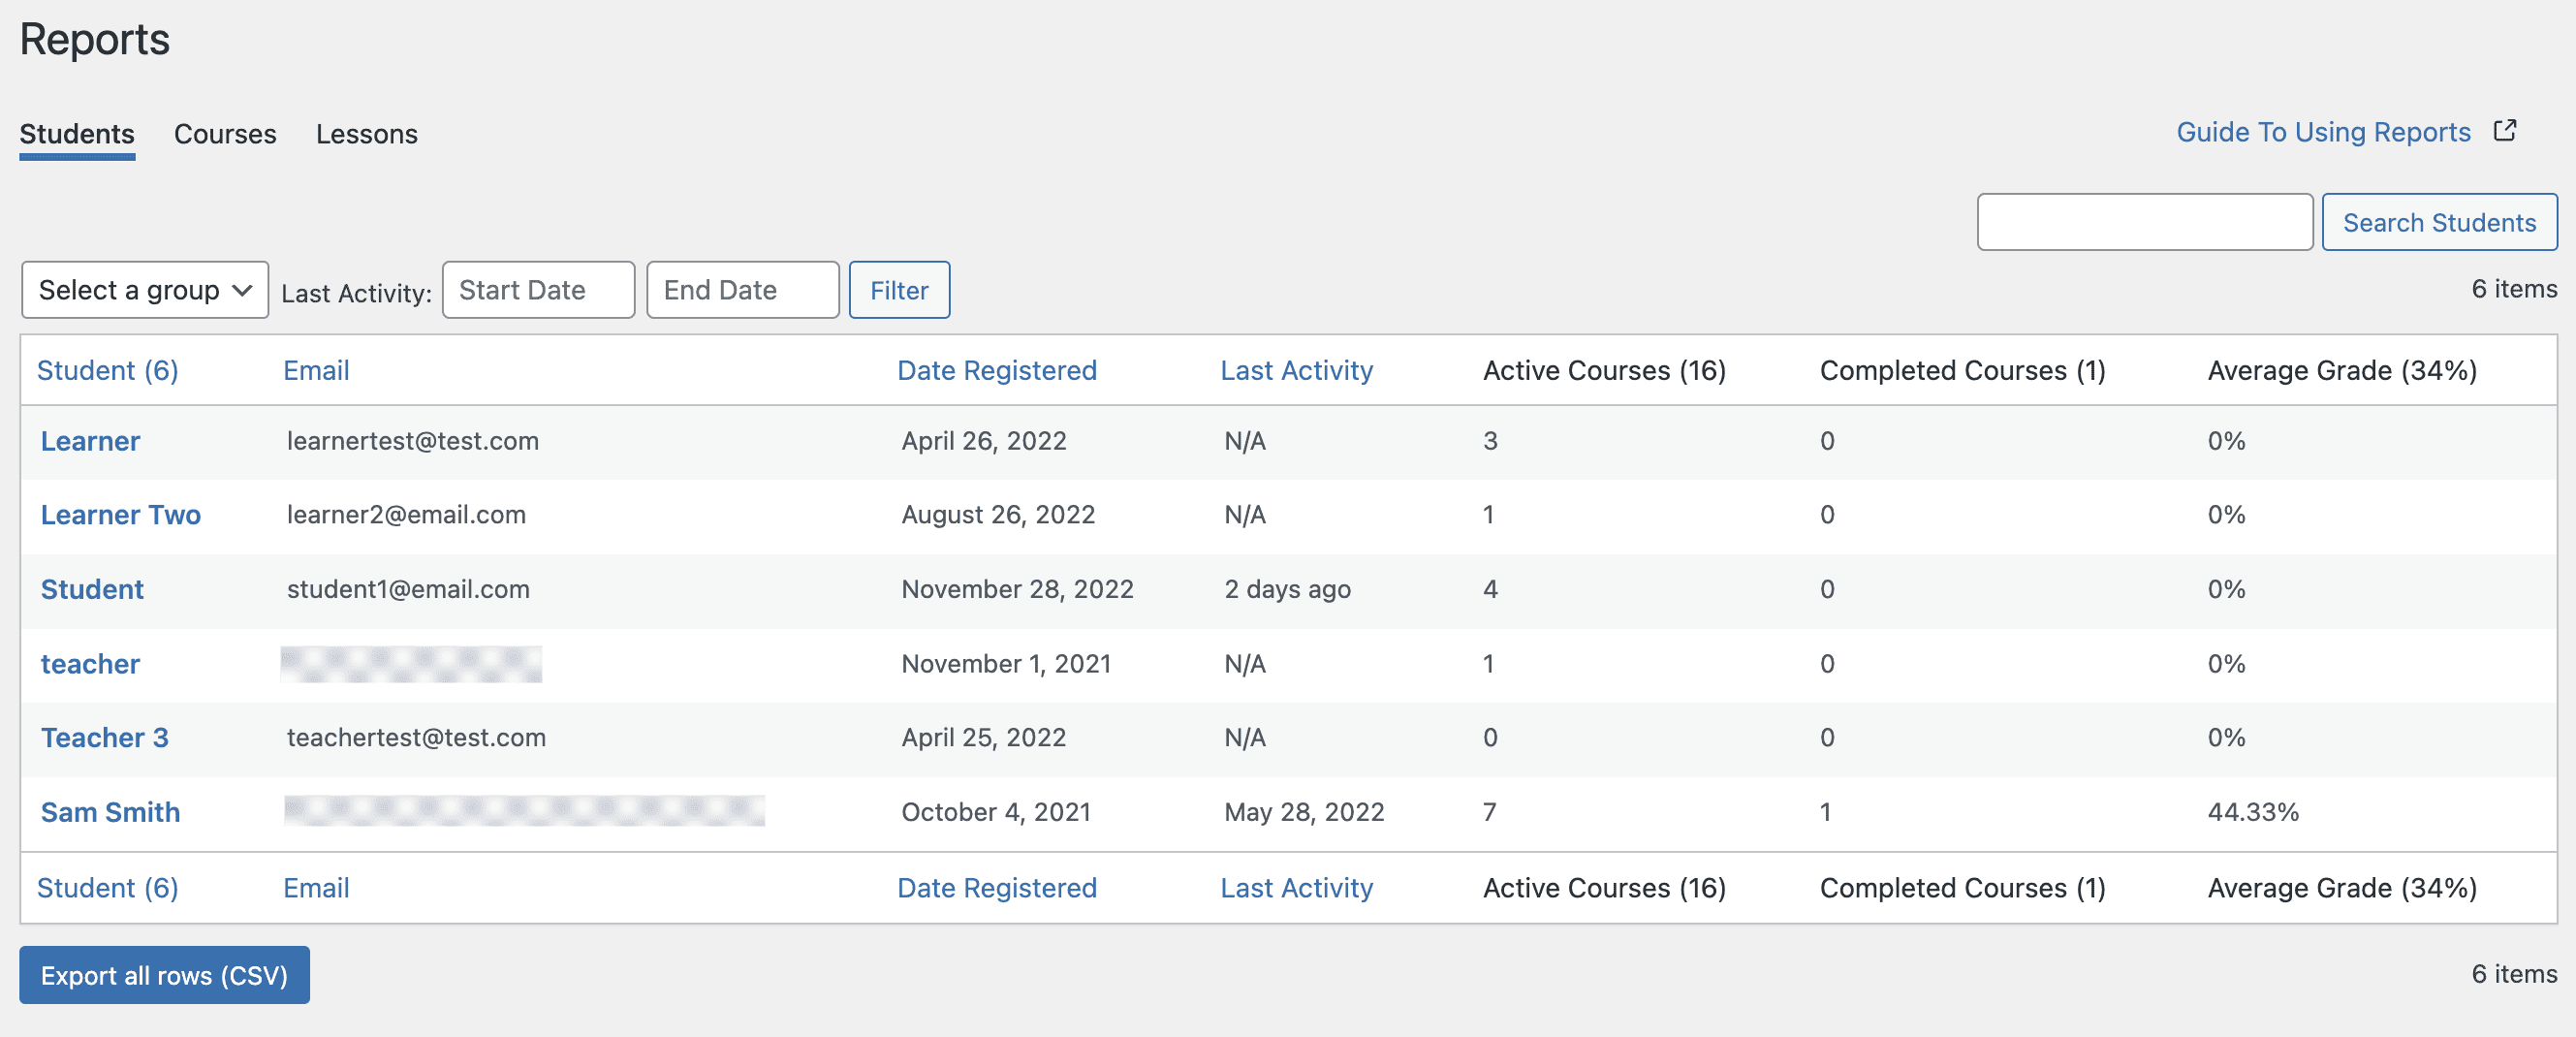
If you wish to filter students by date, simply click the date bar and a calendar will appear. Select the start and end date you wish to view and click Filter. The following information will display:
- Student – Student’s username
- Email – Student’s email address
- Date Registered – Date on which the learner registered on your site
- Last Activity – Last day the learner interact with your courses
- Active Courses – Number of courses the learner is currently enrolled in
- Completed Courses – Number of courses the learner has completed
- Average Grade – Learner’s average grade across all courses
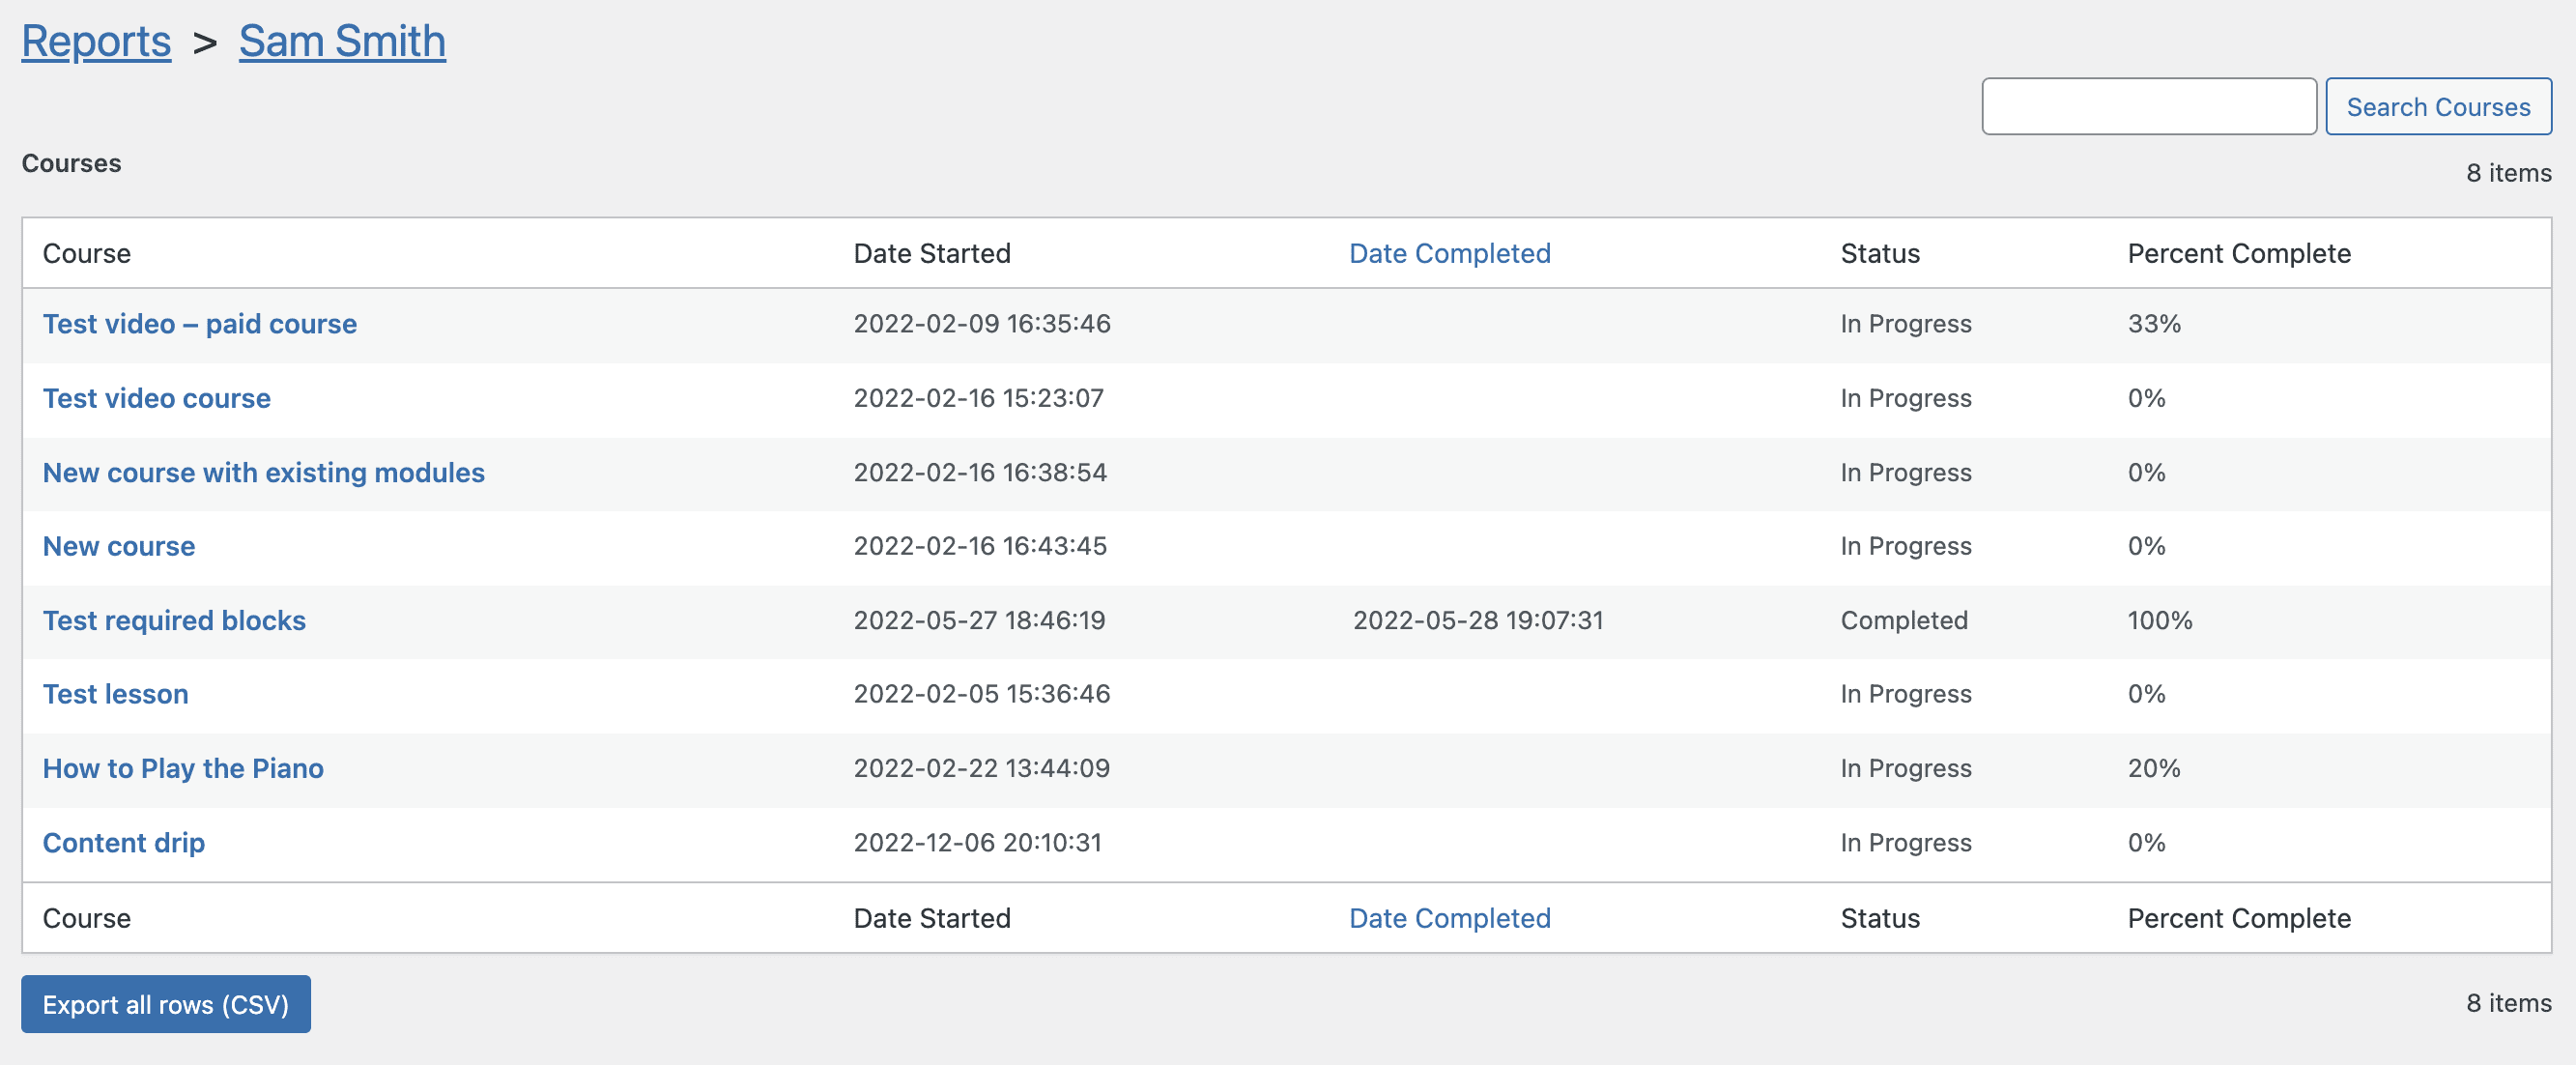
Selecting the name of a particular student will display a page with the following information:
- Course – Name of the course
- Date Started – Date on which the learner started the course
- Date Completed – Date on which the learner completed the course
- Status – Course status
- Percent Complete – Percentage of the course the learner has completed so far
Drilling down even further into a specific course displays the student’s progress at the lesson level:
- Lesson – Name of the lesson
- Date Started – Date on which the learner started the course
- Date Completed – Date on which the learner completed the course
- Status – Course status
- Grade – Student’s grade for that lesson, if applicable
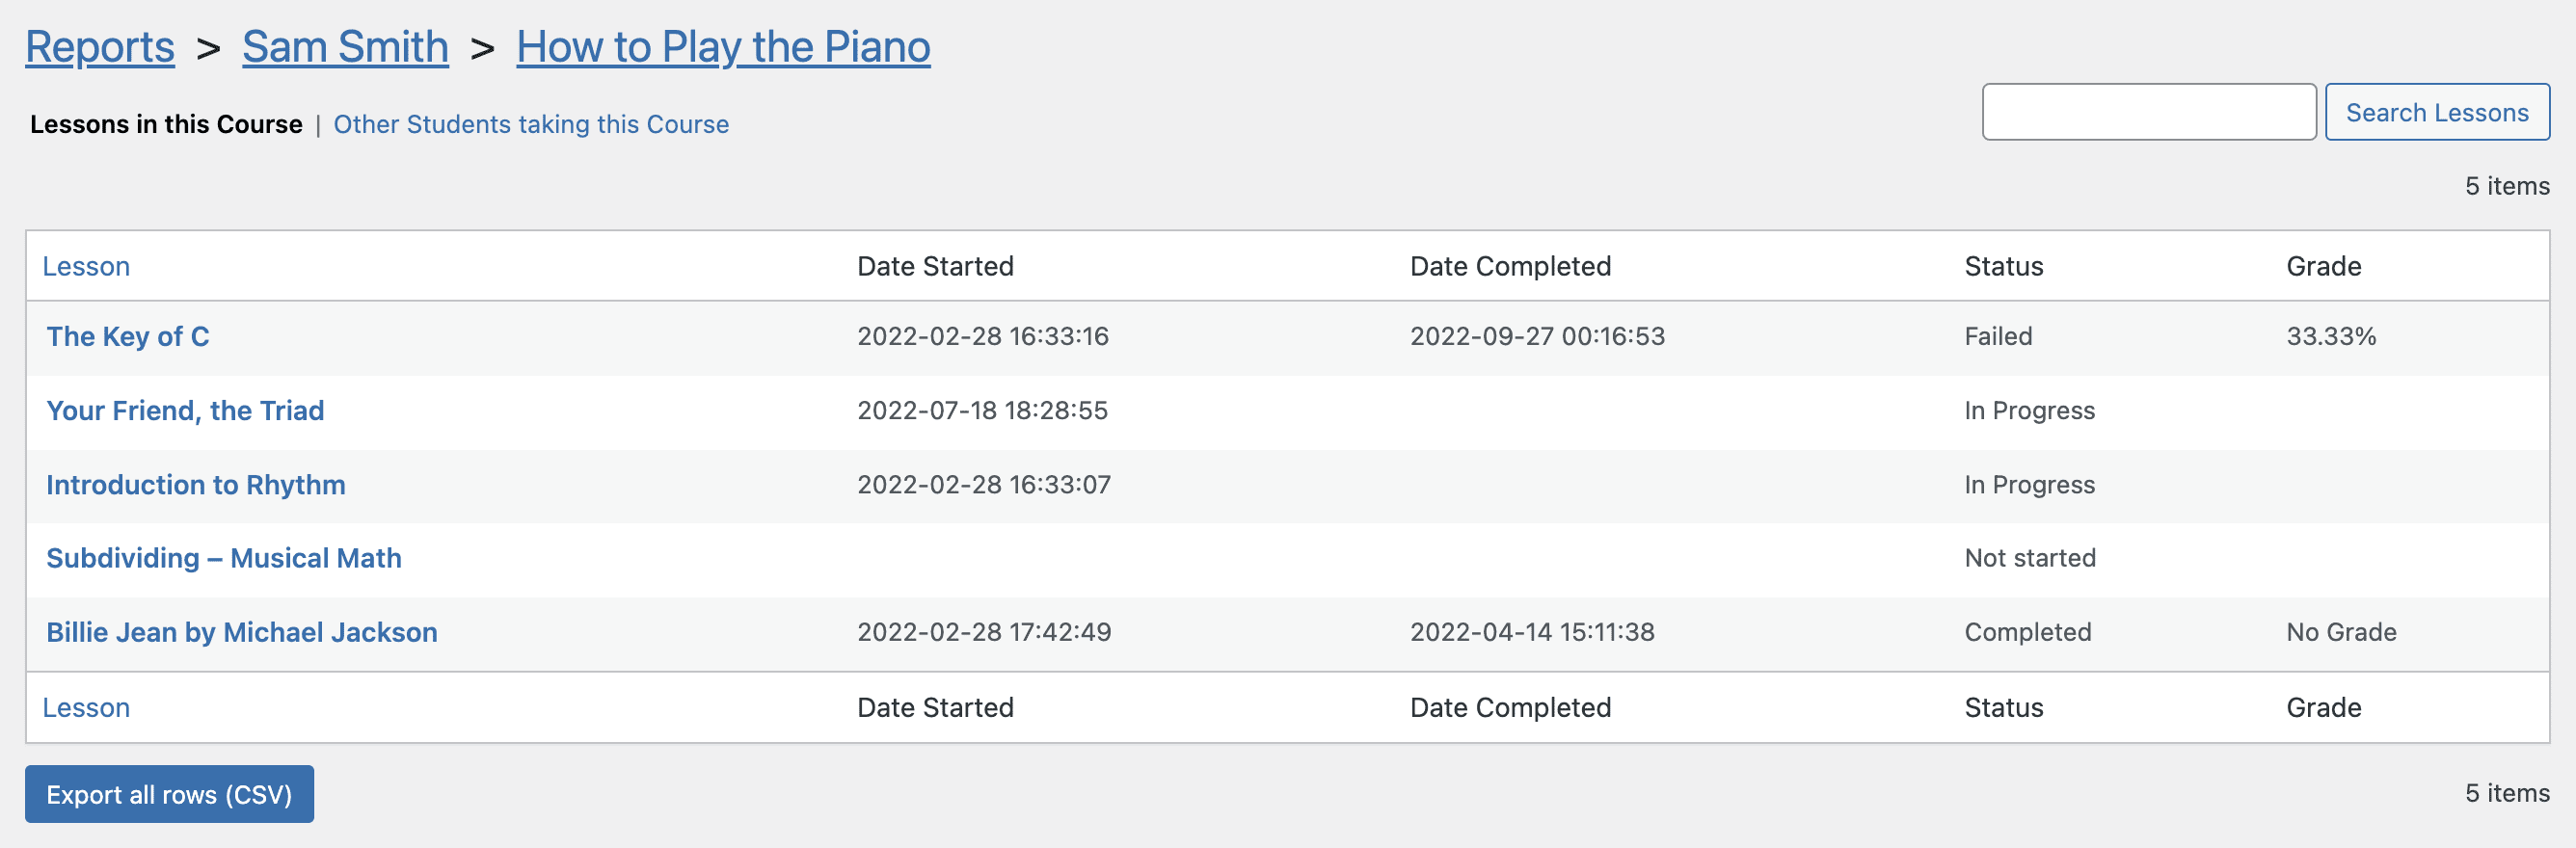
The Other Students taking this Course view shows all other learners currently enrolled in the course.
Courses Report
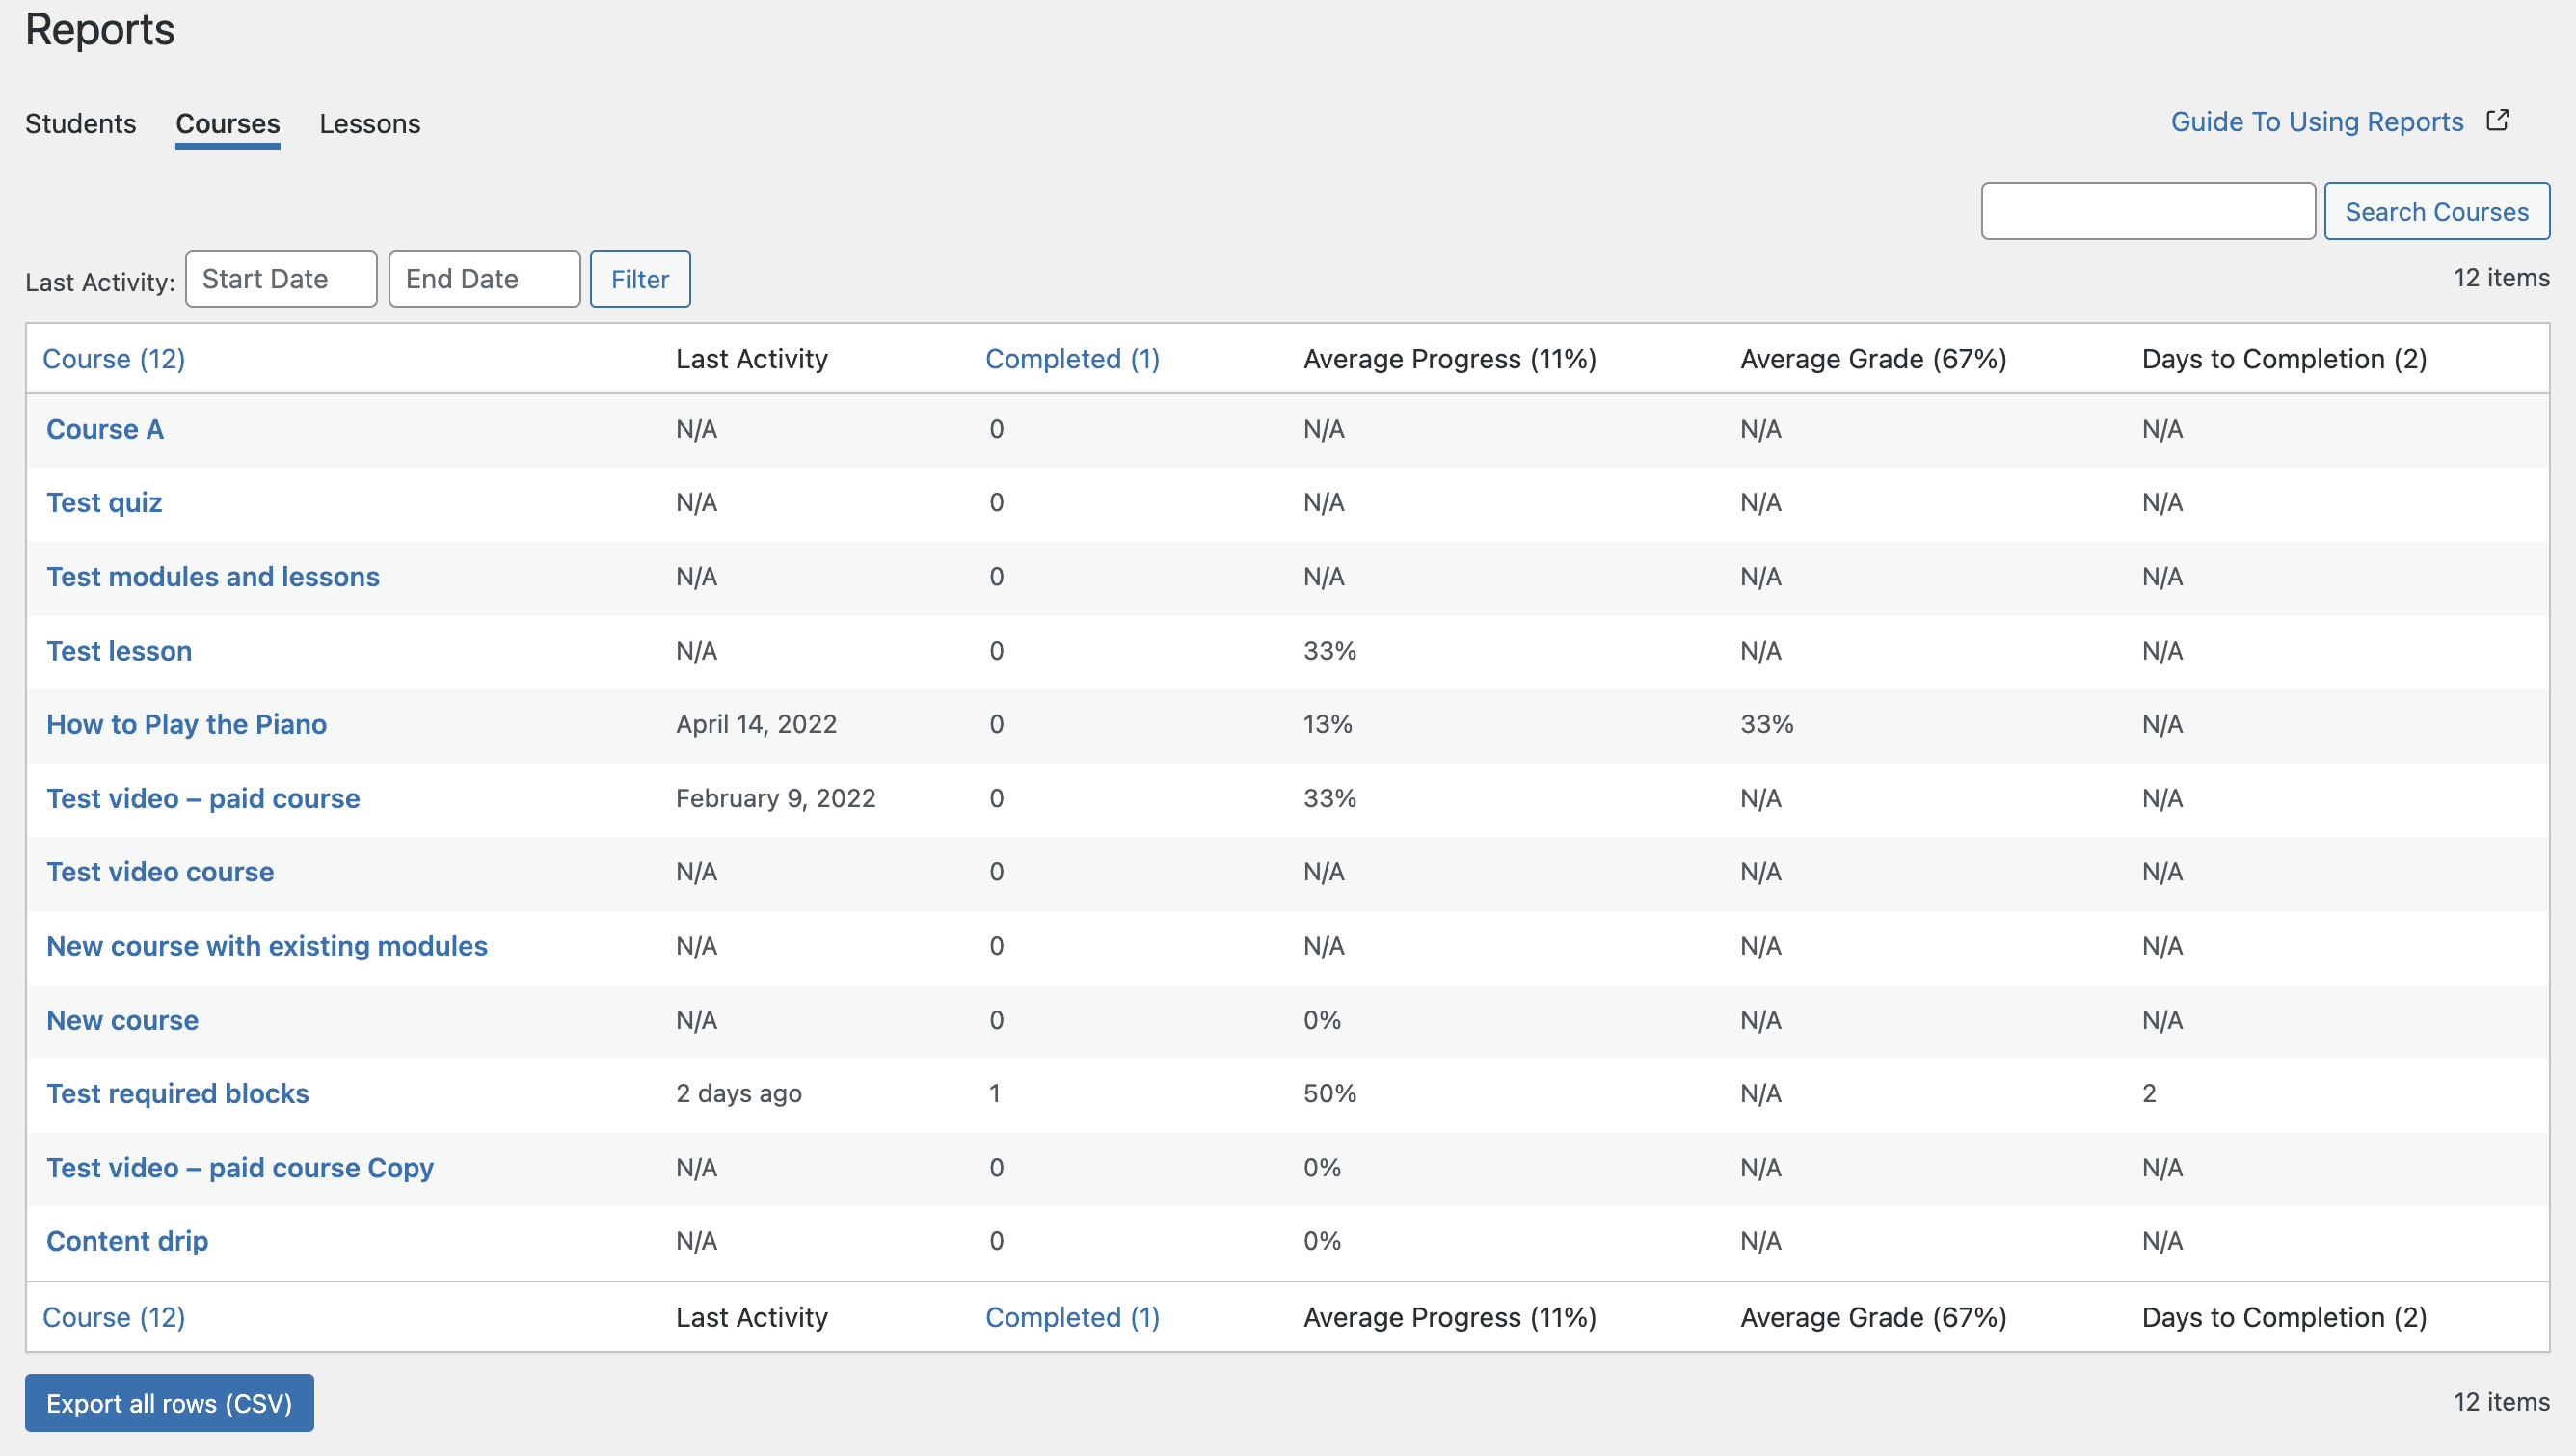
Similar to the Student’s view, the Courses view displays an overview of your courses with some statistics in order to keep track of all of your courses in one place. Easily see the last activity date of each course, average quiz scores, and how long it takes students to complete a course.
- Course – Name of the course
- Last Activity – Last day the student interact with the lesson
- Completed – Number of learners who have completed the course
- Average Progress – Student’s average percentage of the course progress
- Average Grade – Student’s average grade across course, if applicable
- Days to completion – Average number of days it has taken students that start a lesson to complete it.
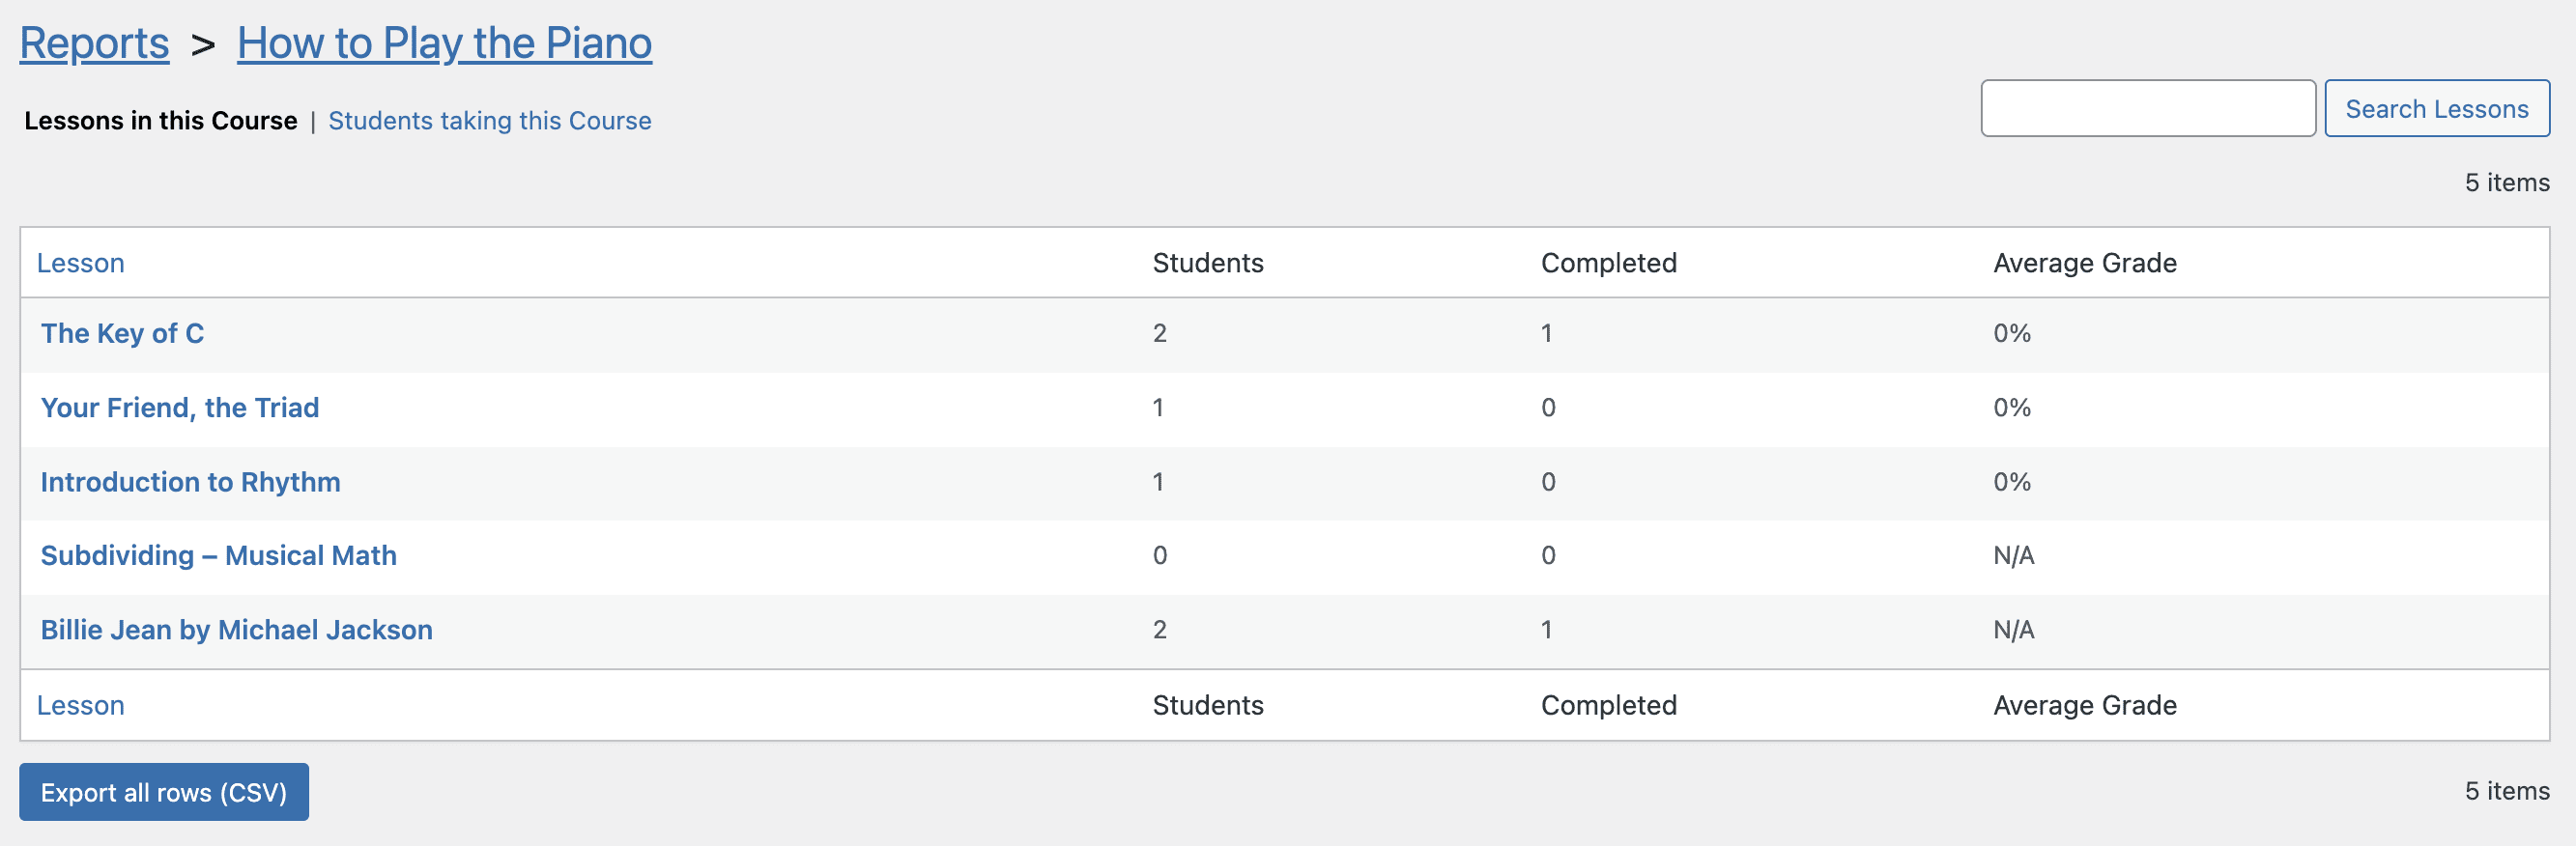
Drilling down into a particular course displays a page that lists all the lessons in the course, as well as the following stats:
- Lesson – Name of the lesson
- Students – Number of learners who are currently taking or have already completed the lesson
- Completed – Number of learners who have completed the lesson
- Average Grade – Average grade of the lesson, if applicable
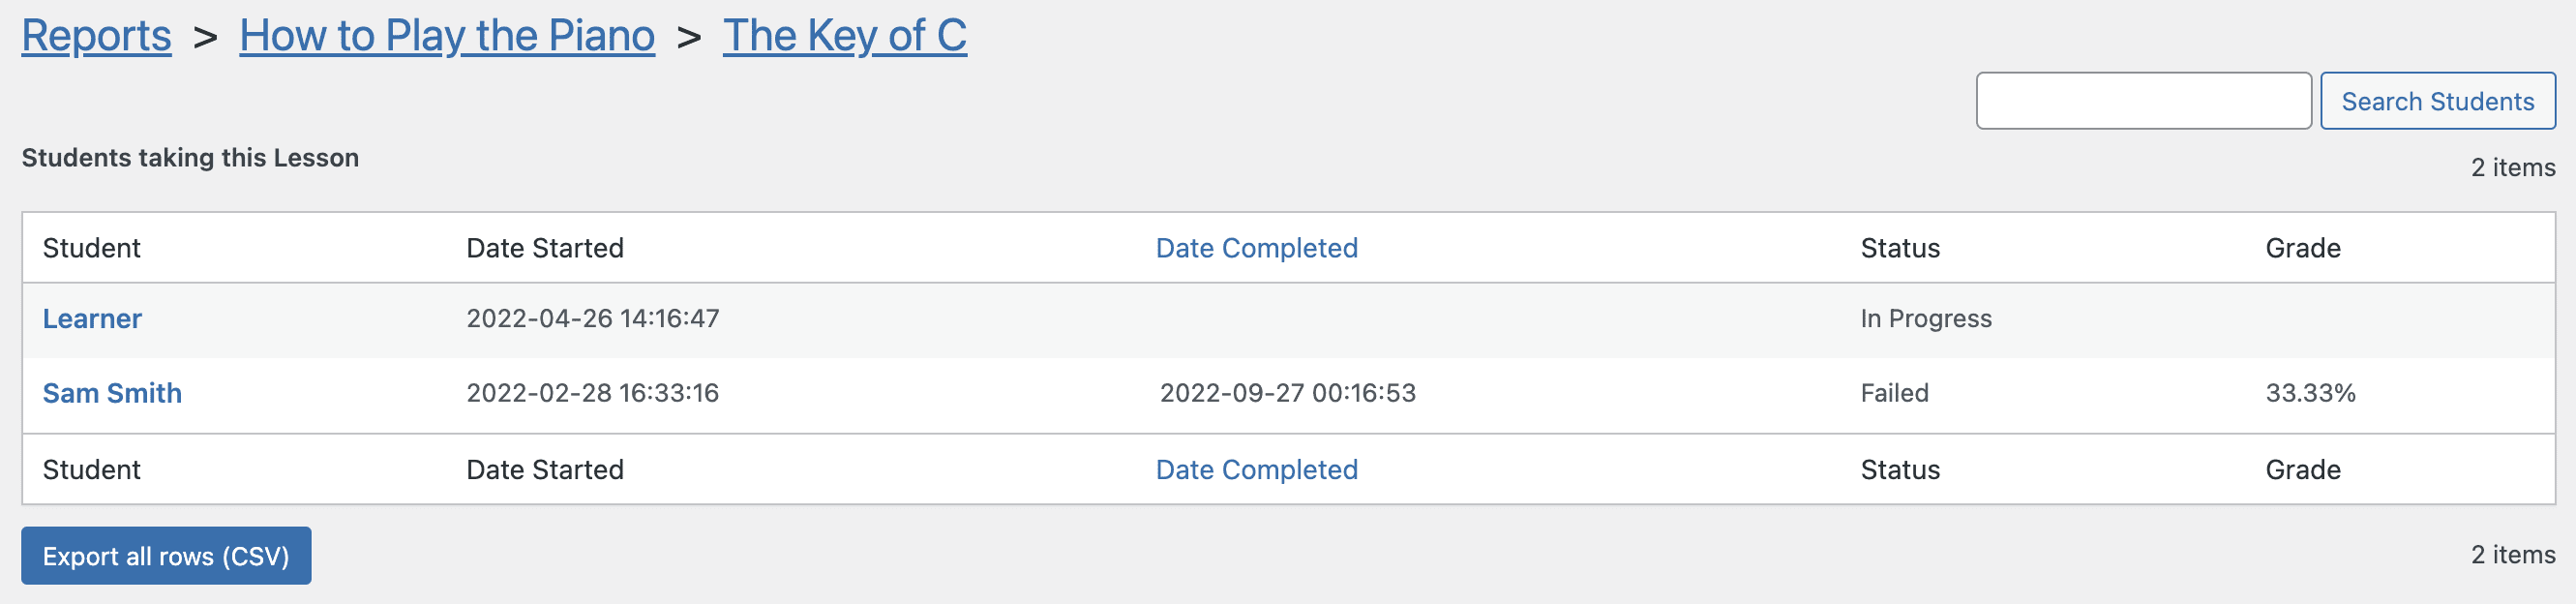
Drilling down even further into a specific lesson displays all students who are currently taking or have already completed the lesson:
Lessons Report
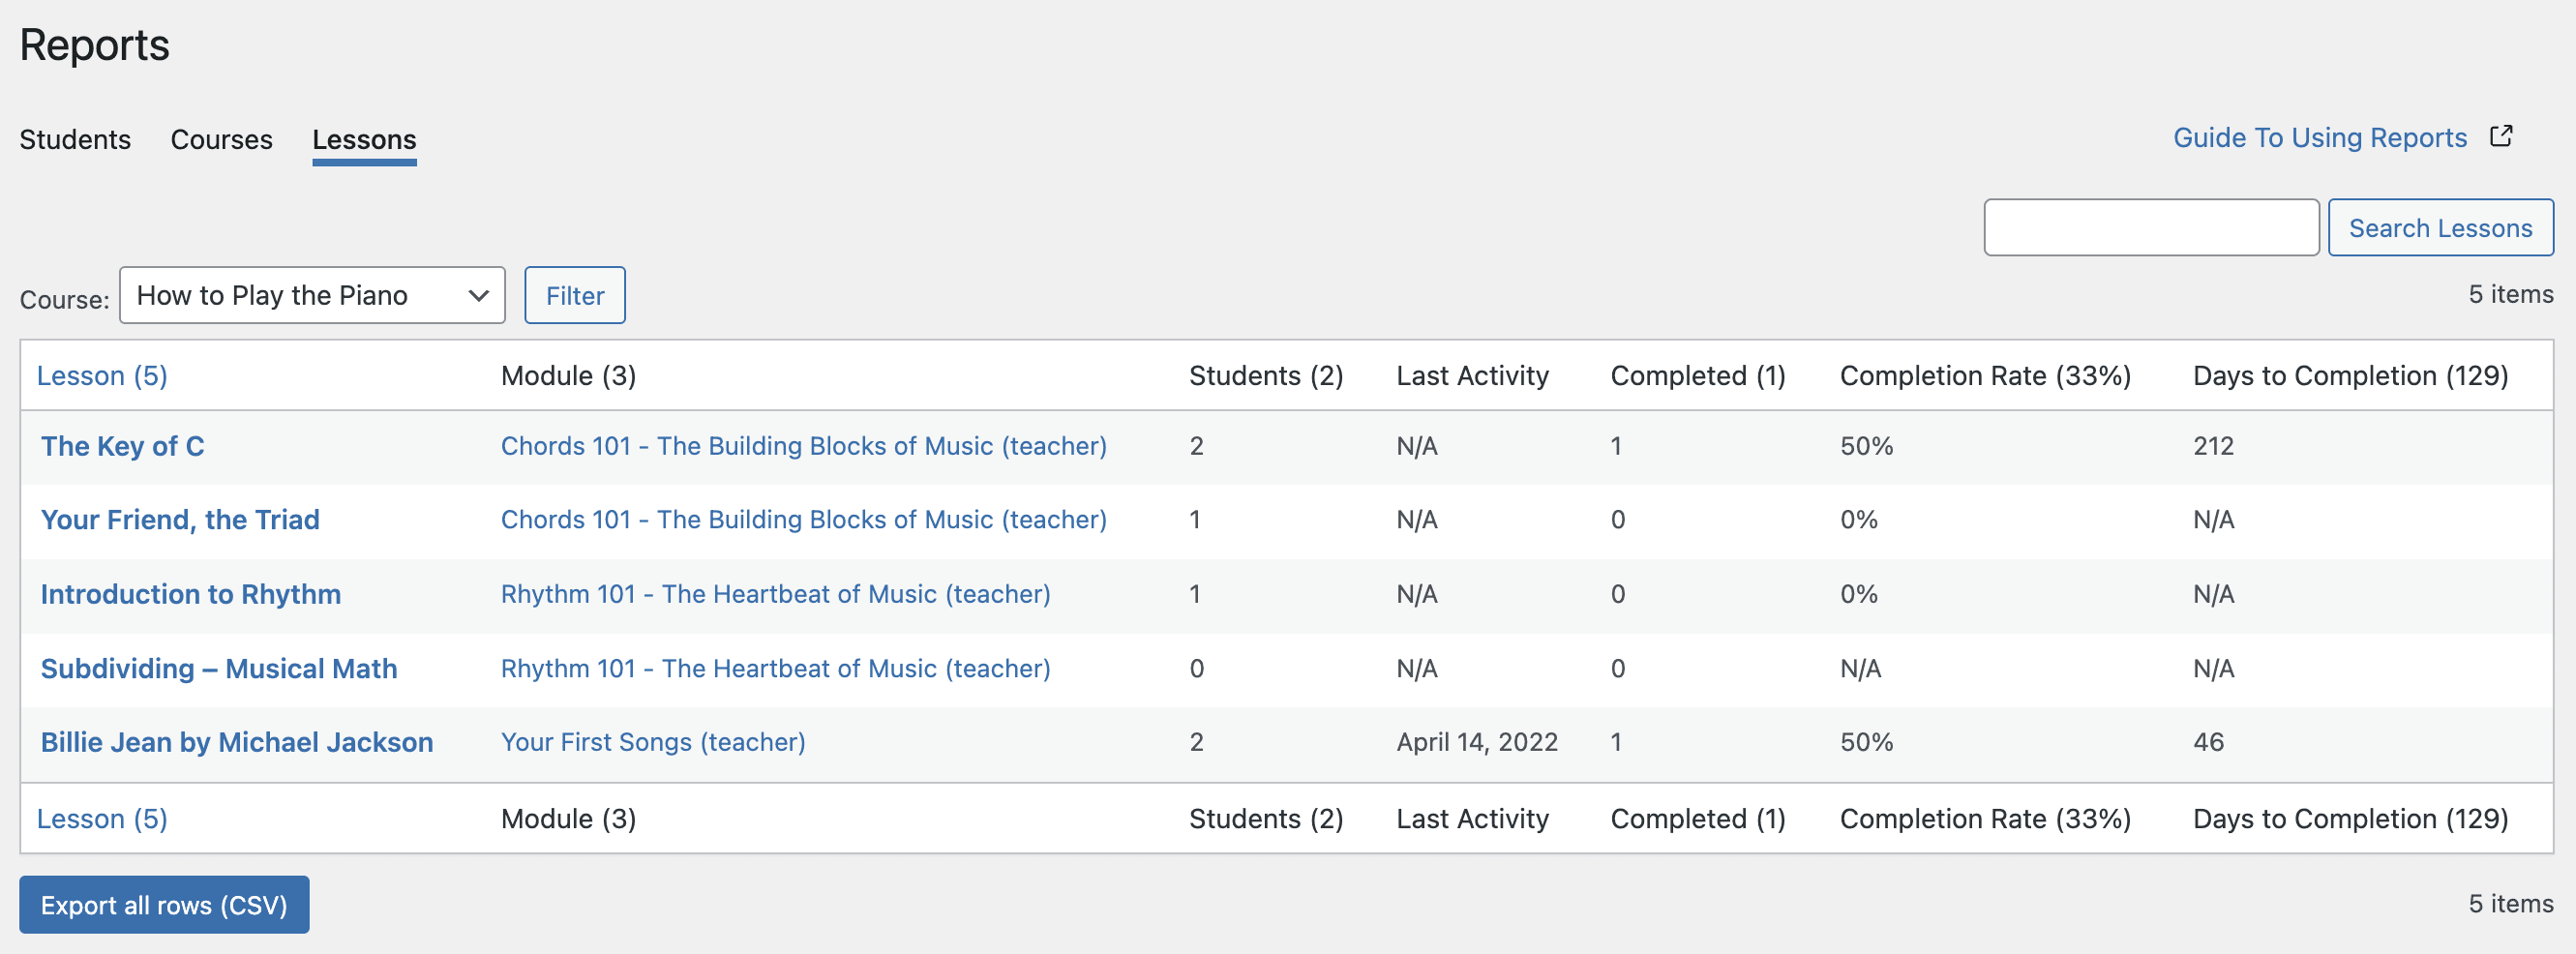
Much like the Students and Courses views, the Lessons view gives you valuable insight into lesson performance. With detailed Completion Rates and Days to Completion metrics, you can pinpoint lessons that may need updates, improvements, or changes to help students better progress through a course. If you have several courses, the Analysis page will ask you to filter by Course first in order to display the lessons.
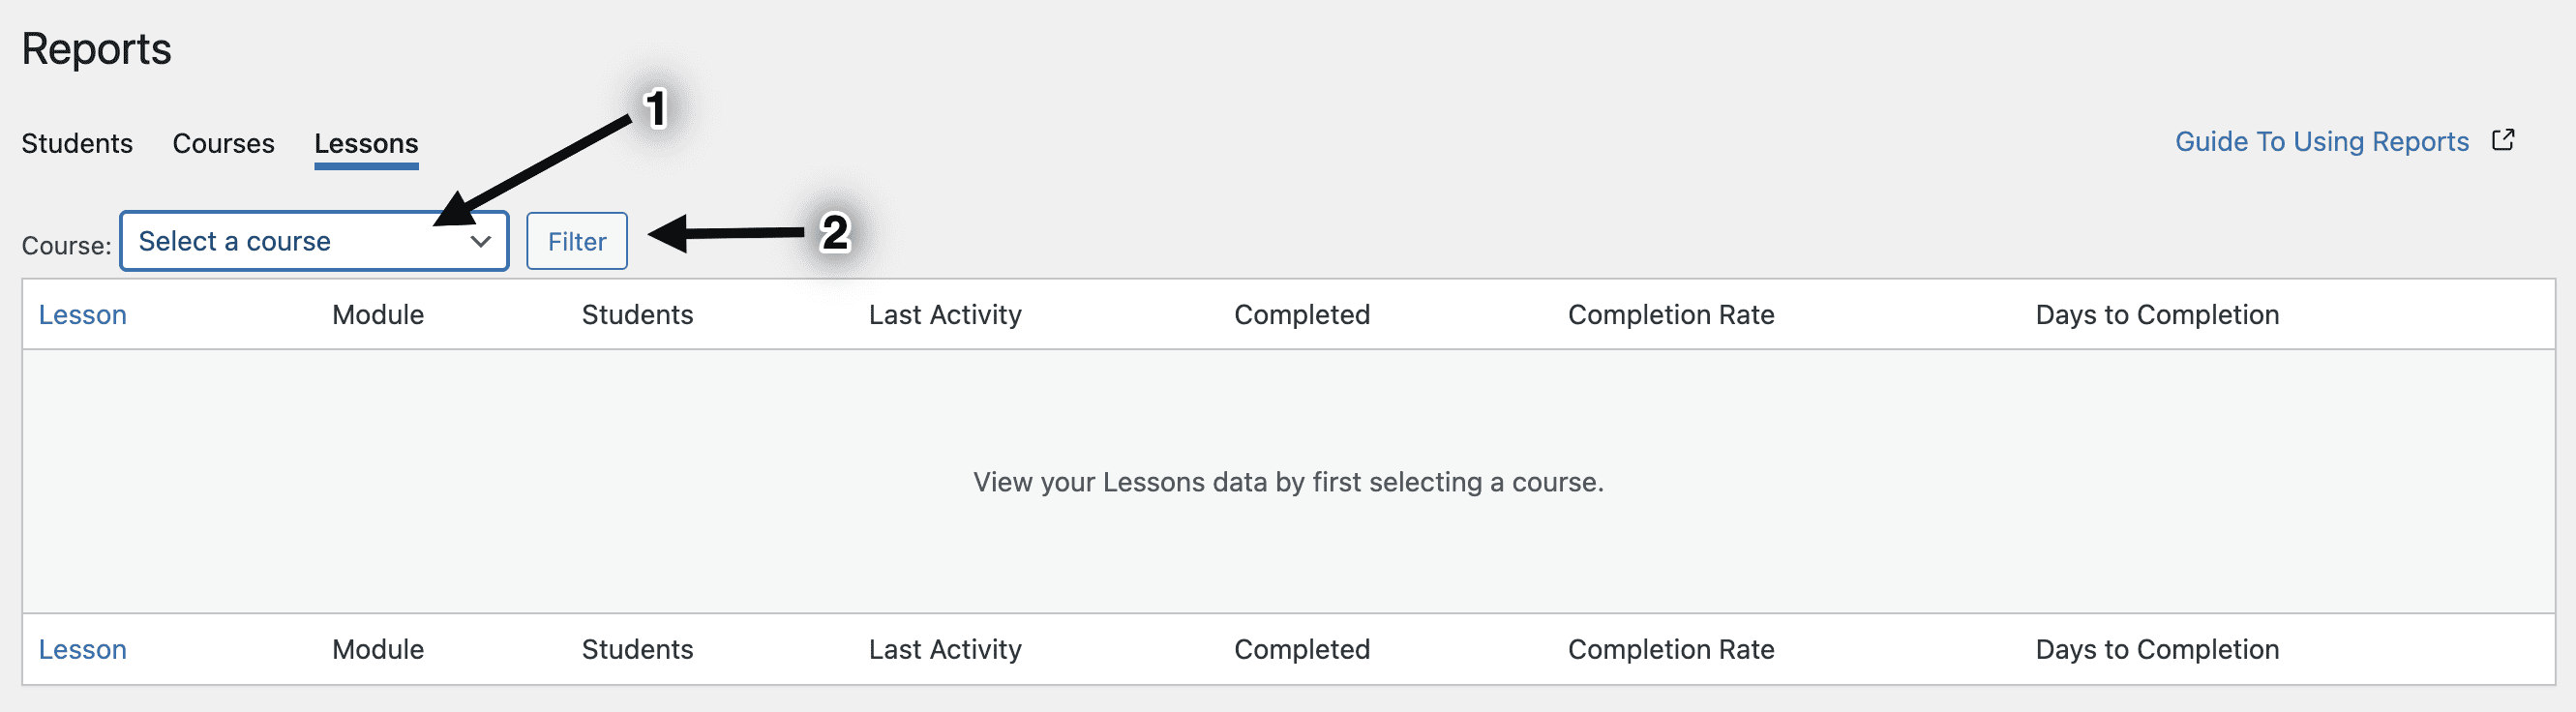
- Lesson – Name of the lesson
- Module – Name of the module the lesson is in
- Students – Number of students who are currently taking or have already completed the lesson
- Last Activity – Last day the learner interact with the lesson
- Completed – Number of students who have completed the lesson
- Completion Rate – Number of students that have completed the lesson divided by the total number of students that have started the lesson.
- Days to completion – Average number of days it has taken students that start a lesson to complete it.
Drilling down into a particular lesson displays a page that lists all the learners who are currently taking or have already completed the lesson. The view is the same as this one.